Turning Blue? The 2026 State Election in Saxony-Anhalt
A Municipality-Level Analysis and the Revenge of the Village
Photos: Marco Verch/ccnull.de (CC BY 2.0, cropped) · pxhere.com (CC0)
The AfD fell just short of an absolute majority in yesterday’s election in Saxony-Anhalt amid sharply higher turnout. Drawing on results from the state’s 218 municipalities and granular data on local socioeconomic characteristics, this piece examines the electoral geography behind the result.
1. Turnout Rises Across the Countryside
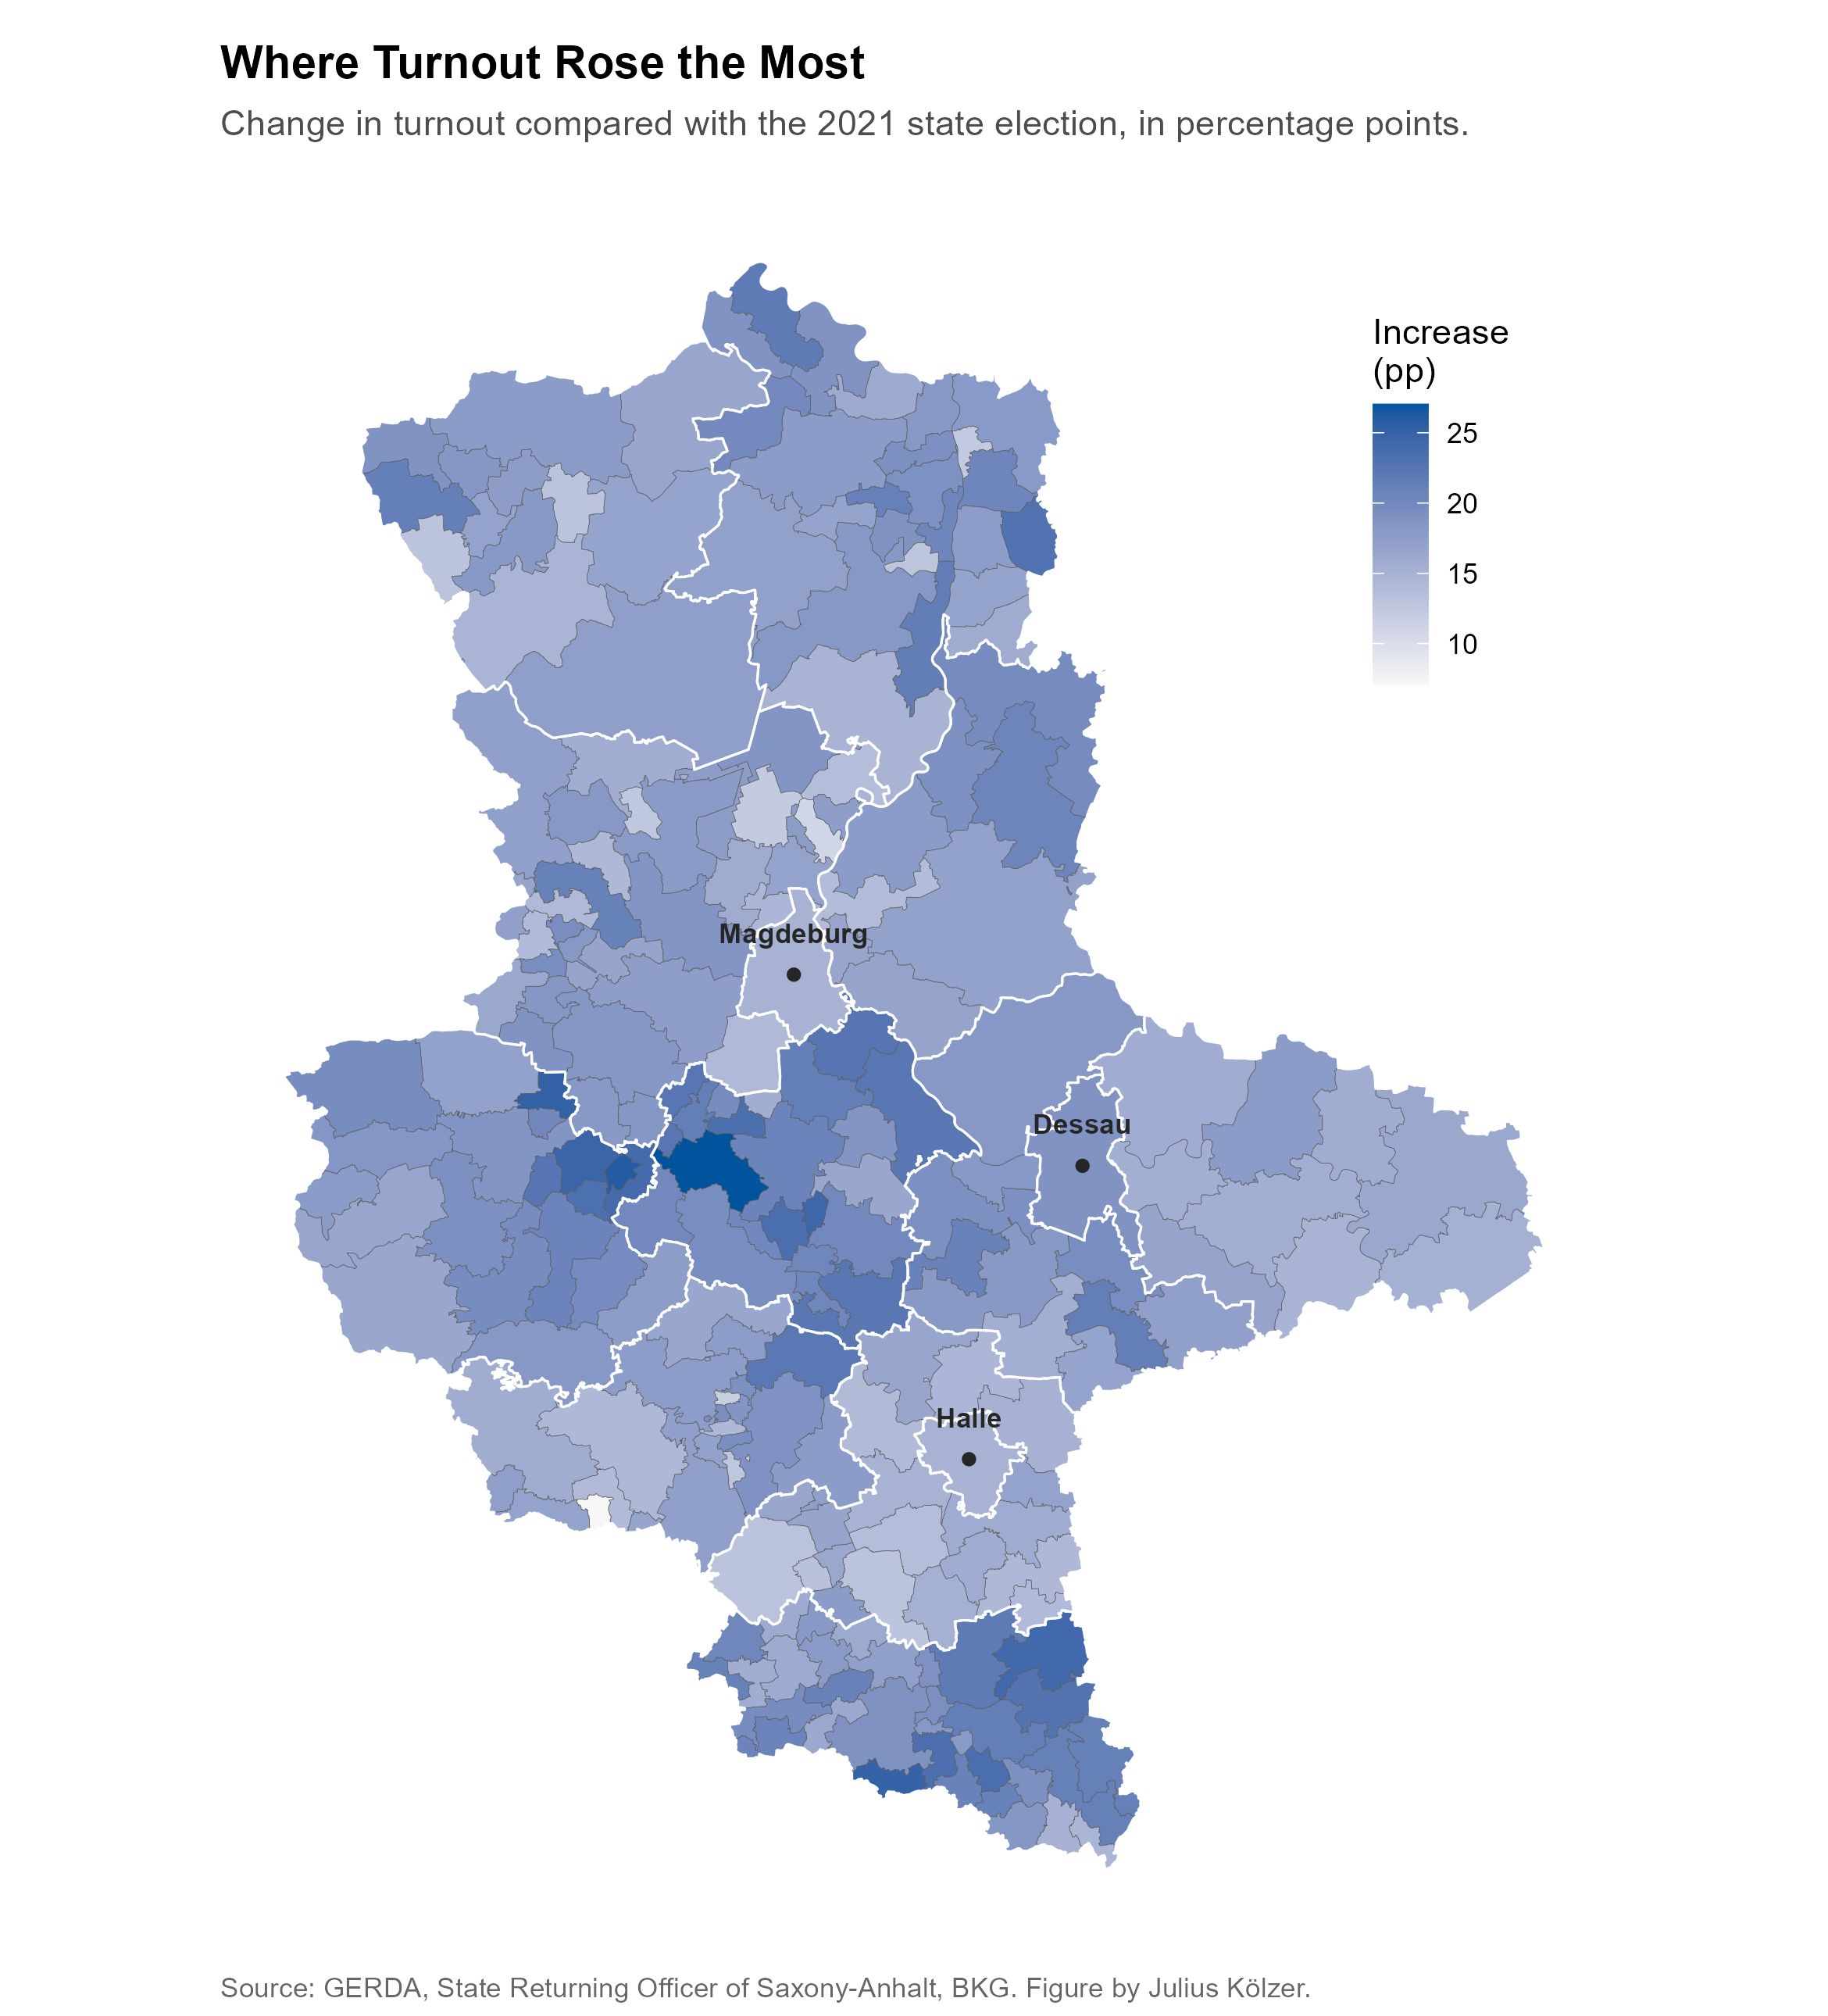
The big game changer in this state election is the enormous rise in turnout. With almost 250,000 additional votes, it rose by 17.5 percentage points, from 60.3 to 77.8 per cent. The increase varies considerably between municipalities. In the more rural municipalities of the Harz, the Salzlandkreis and the Burgenlandkreis in the south of the state, the rise frequently exceeds 20 percentage points. In the state’s two large cities, Halle and Magdeburg, it is markedly smaller: at roughly 15 percentage points each, it even falls below the statewide average.
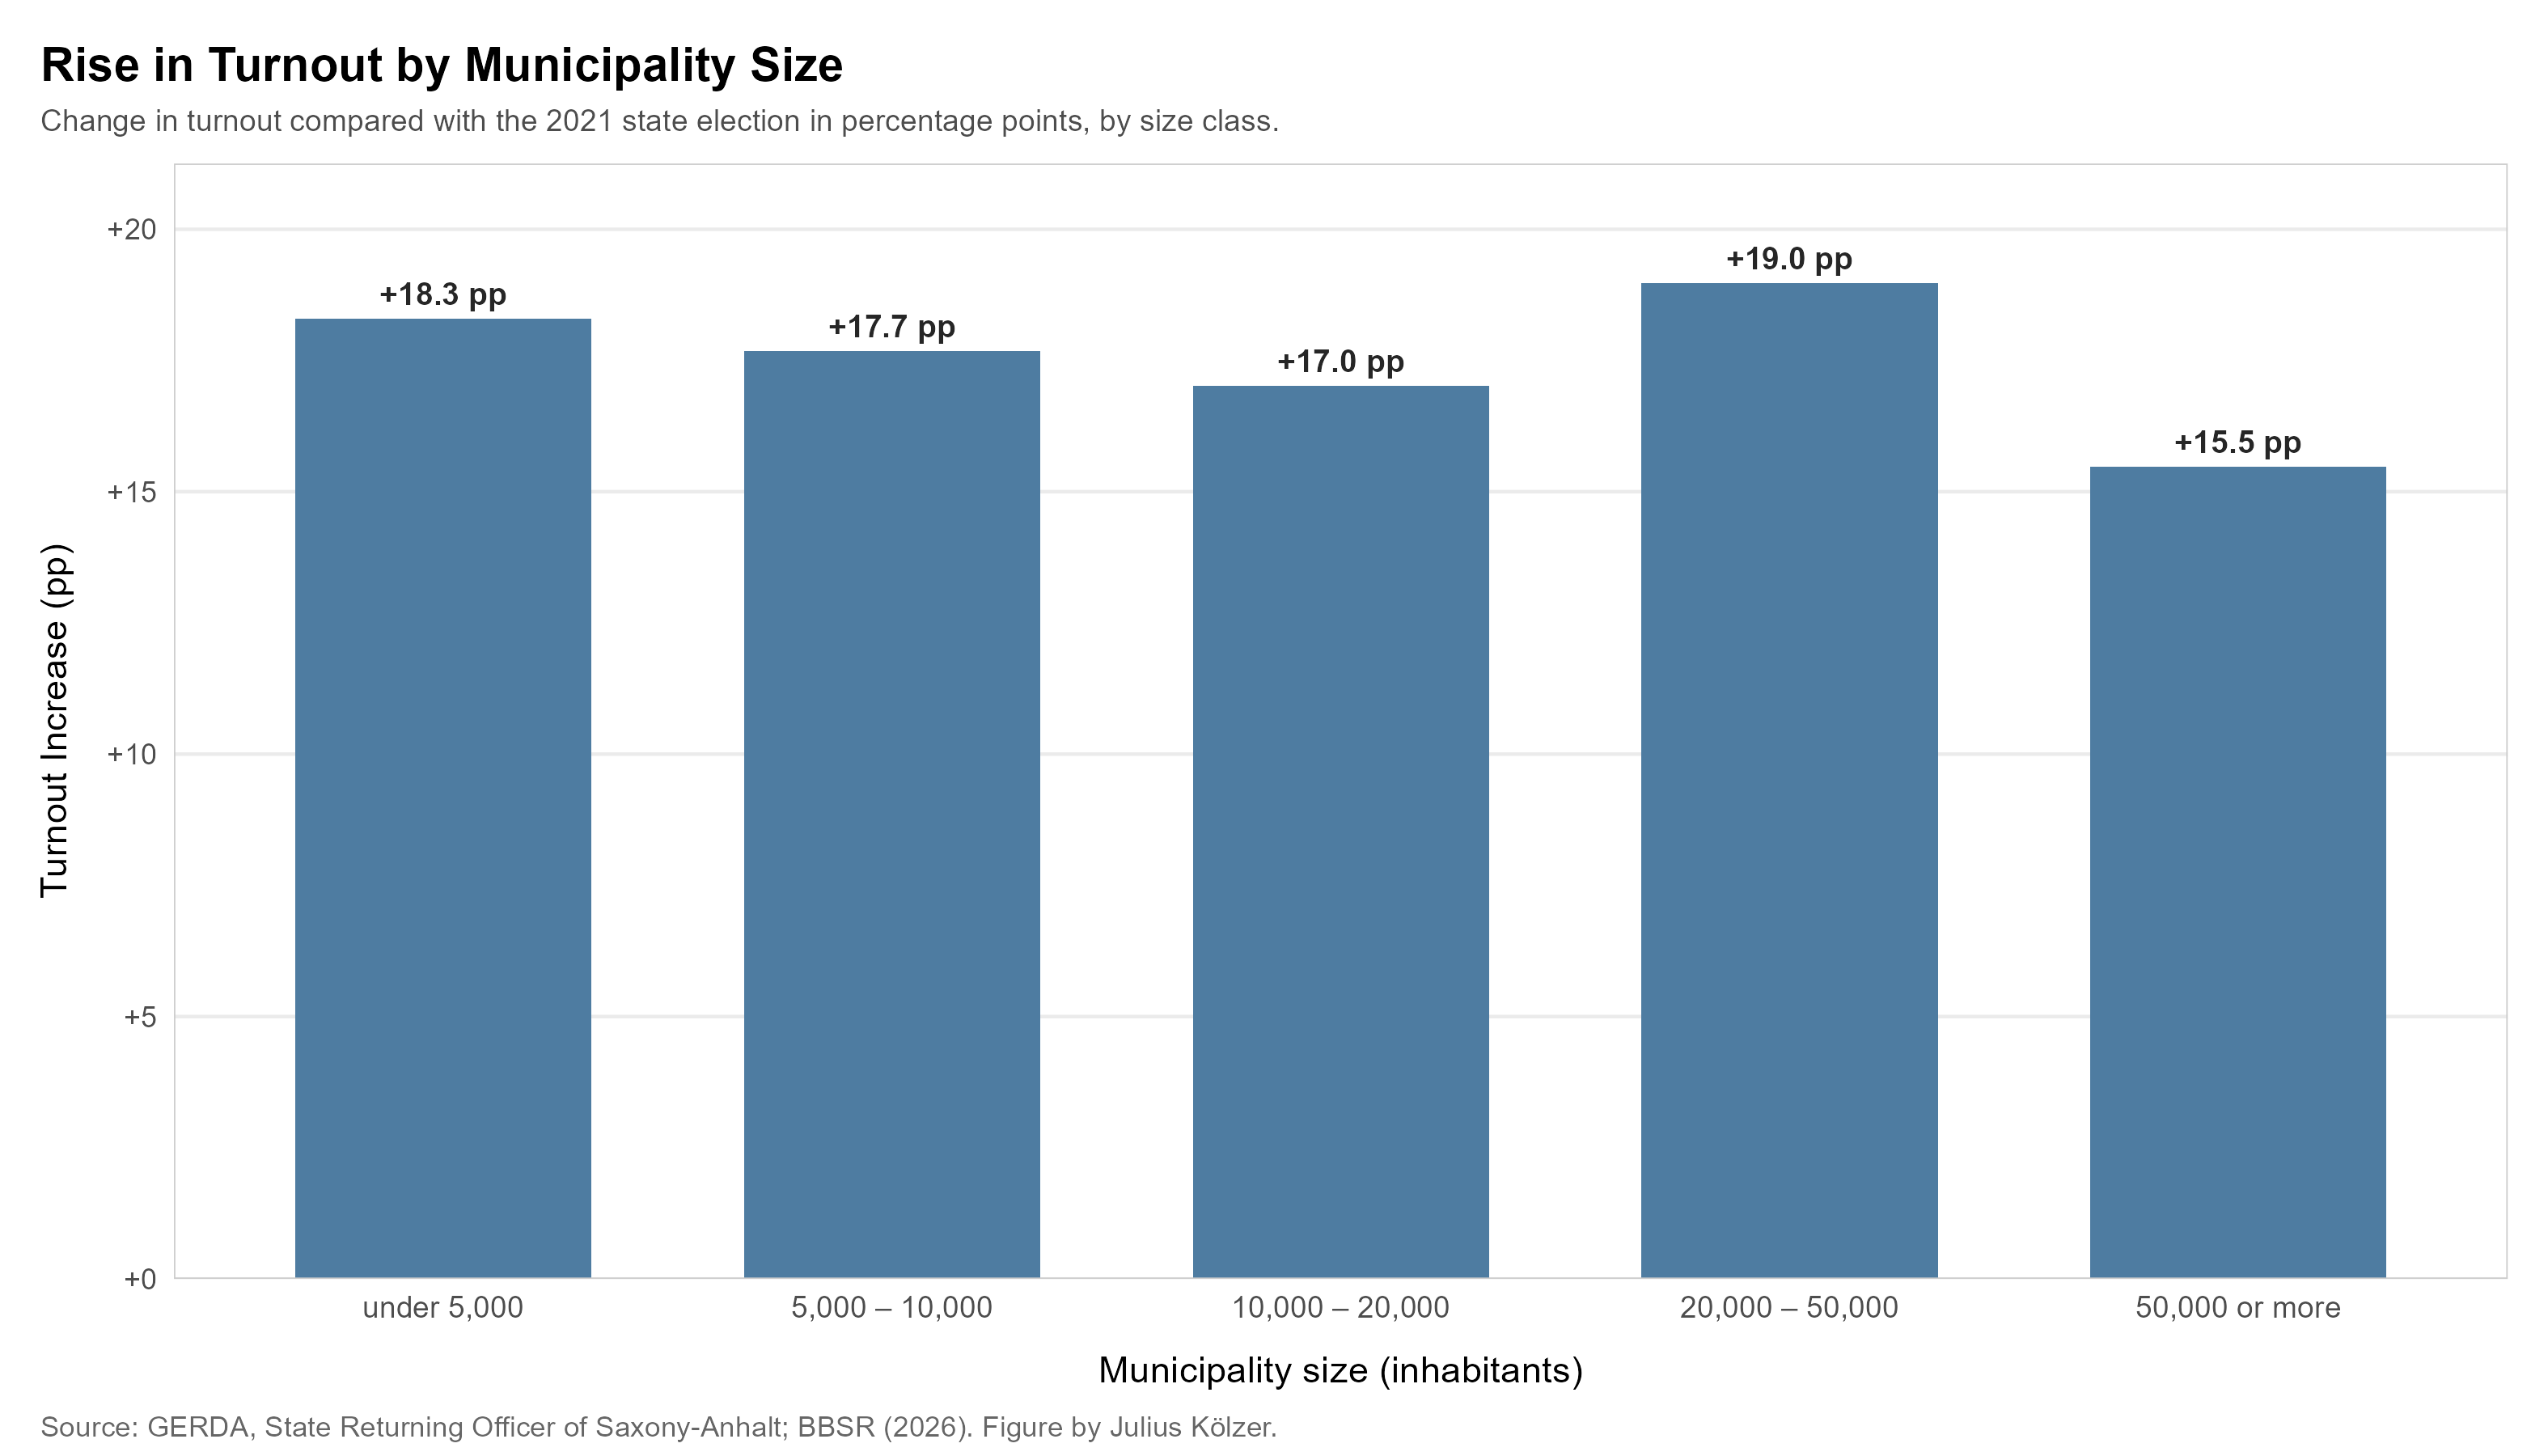
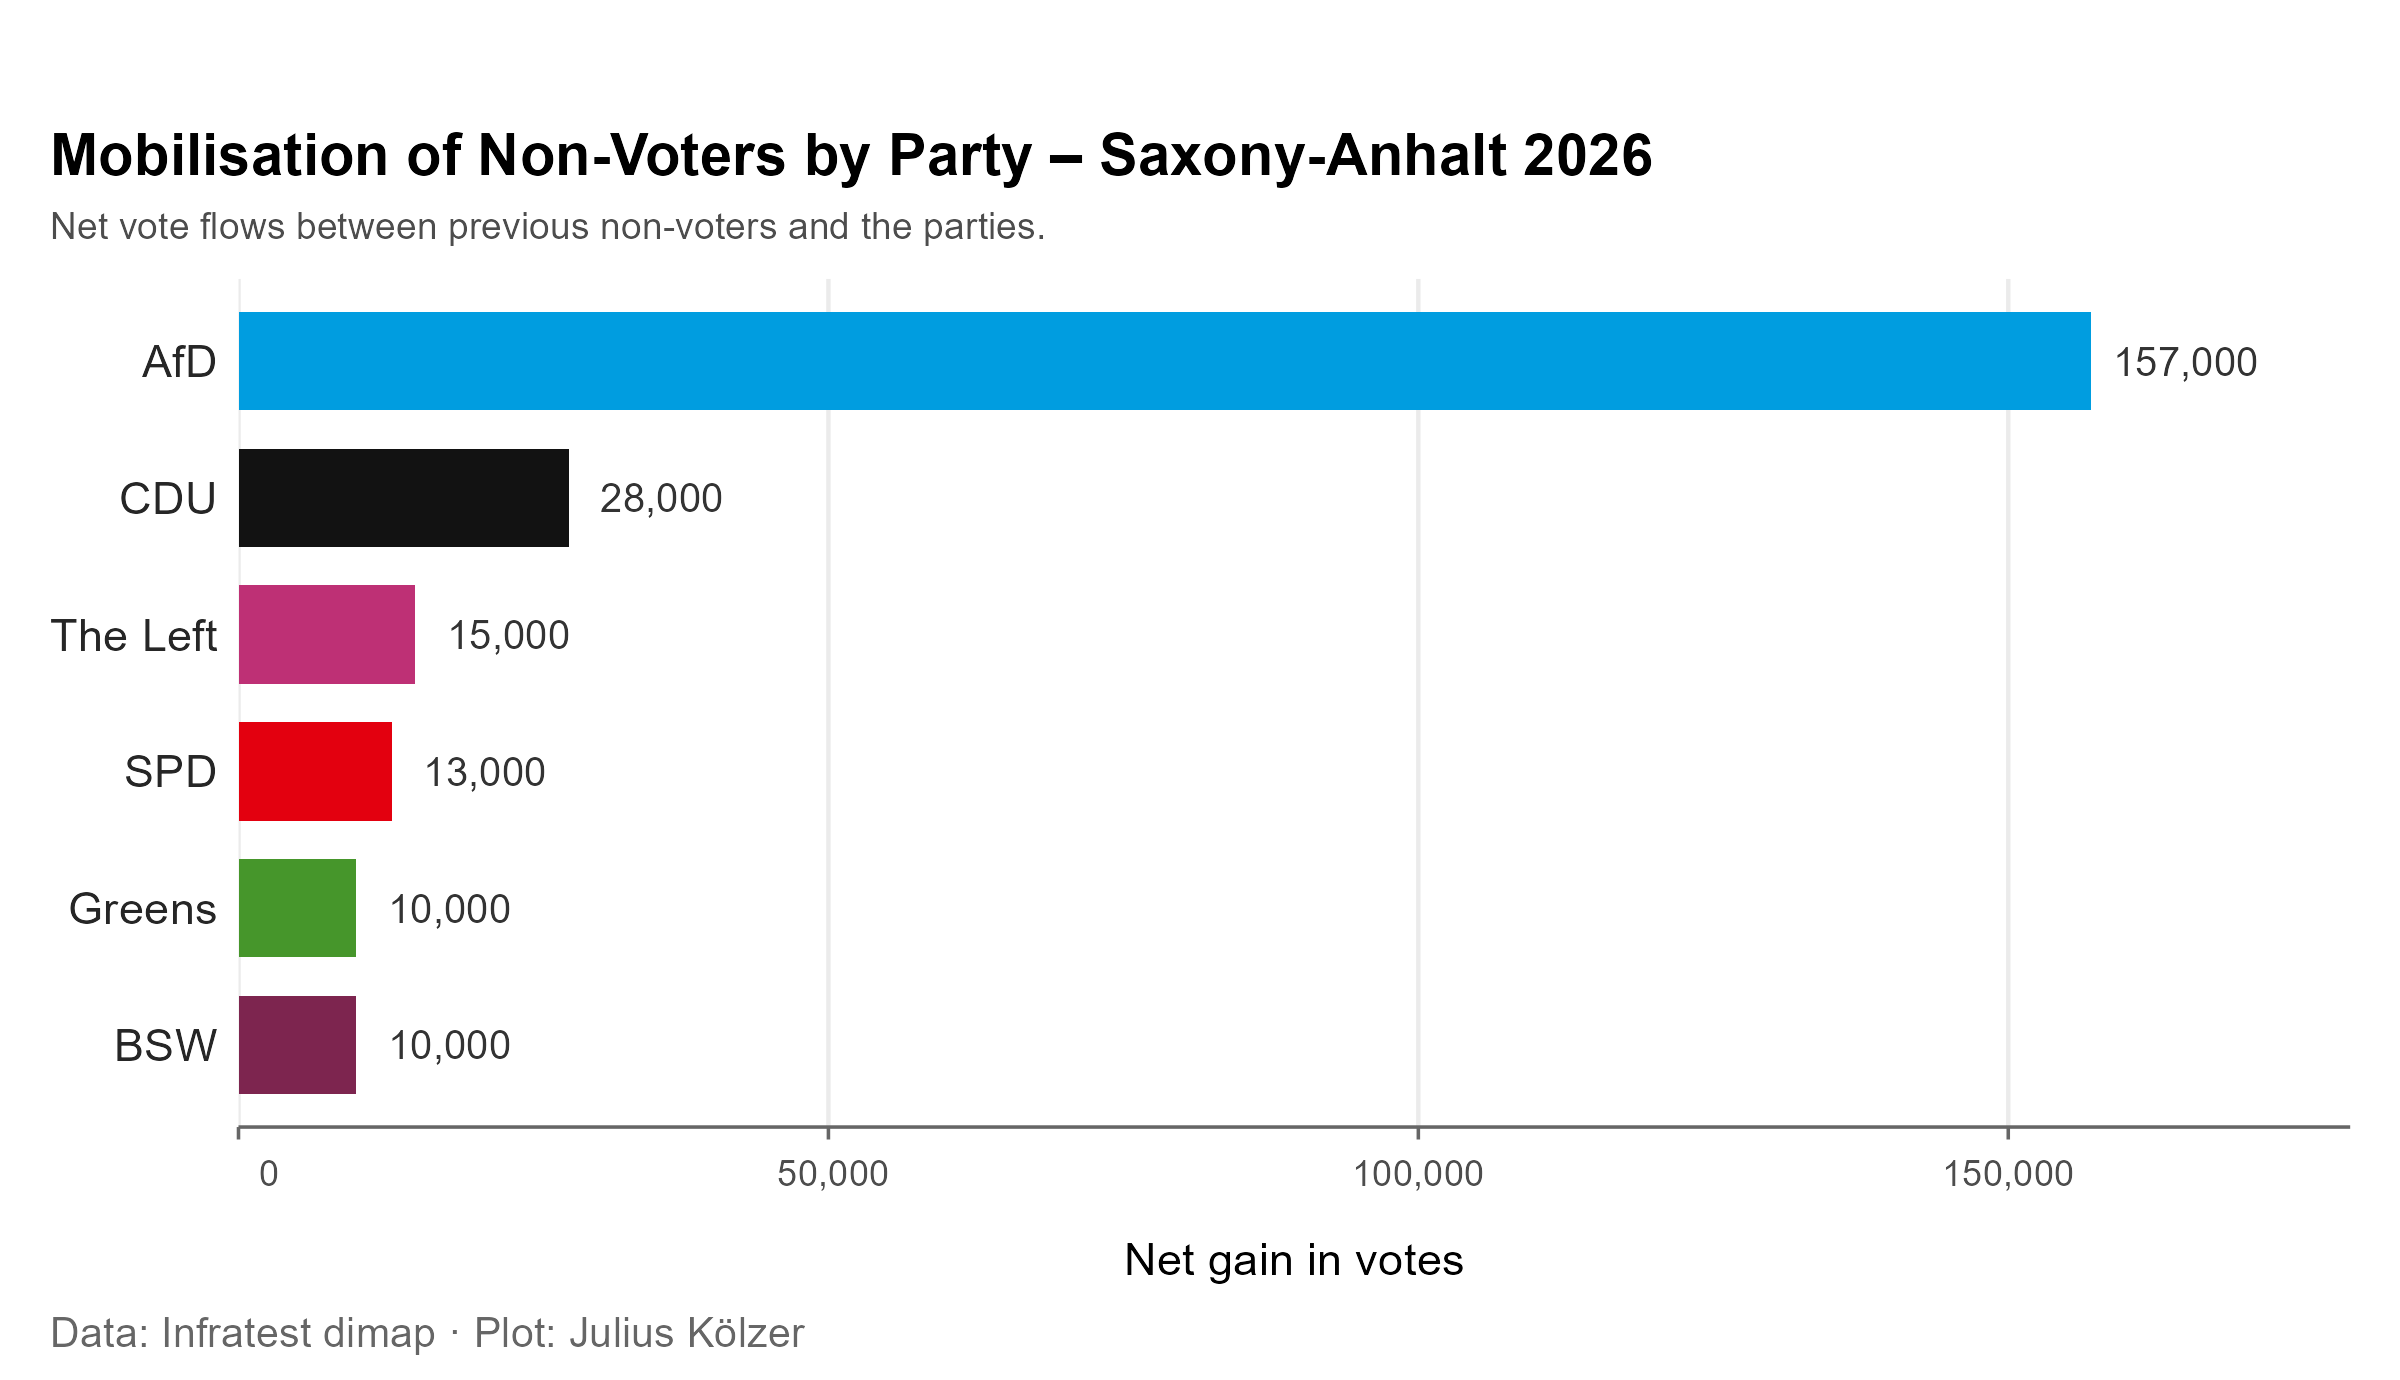
Owing to their population size, the two cities do account for just under 43,000 of the roughly 250,000 newly mobilised votes of former non-voters. The much larger mobilisation effect, however, shows up in the rest of the state: in the municipalities outside the two large cities, around 205,000 votes were added by people who had not voted before. On average, voter turnout increased the most in medium-sized and very small municipalities, rising by 19 and 18 percentage points, respectively. As the bar chart illustrates, the mobilization of previous non-voters was noticeably lower in urban centers, by a few percentage points.
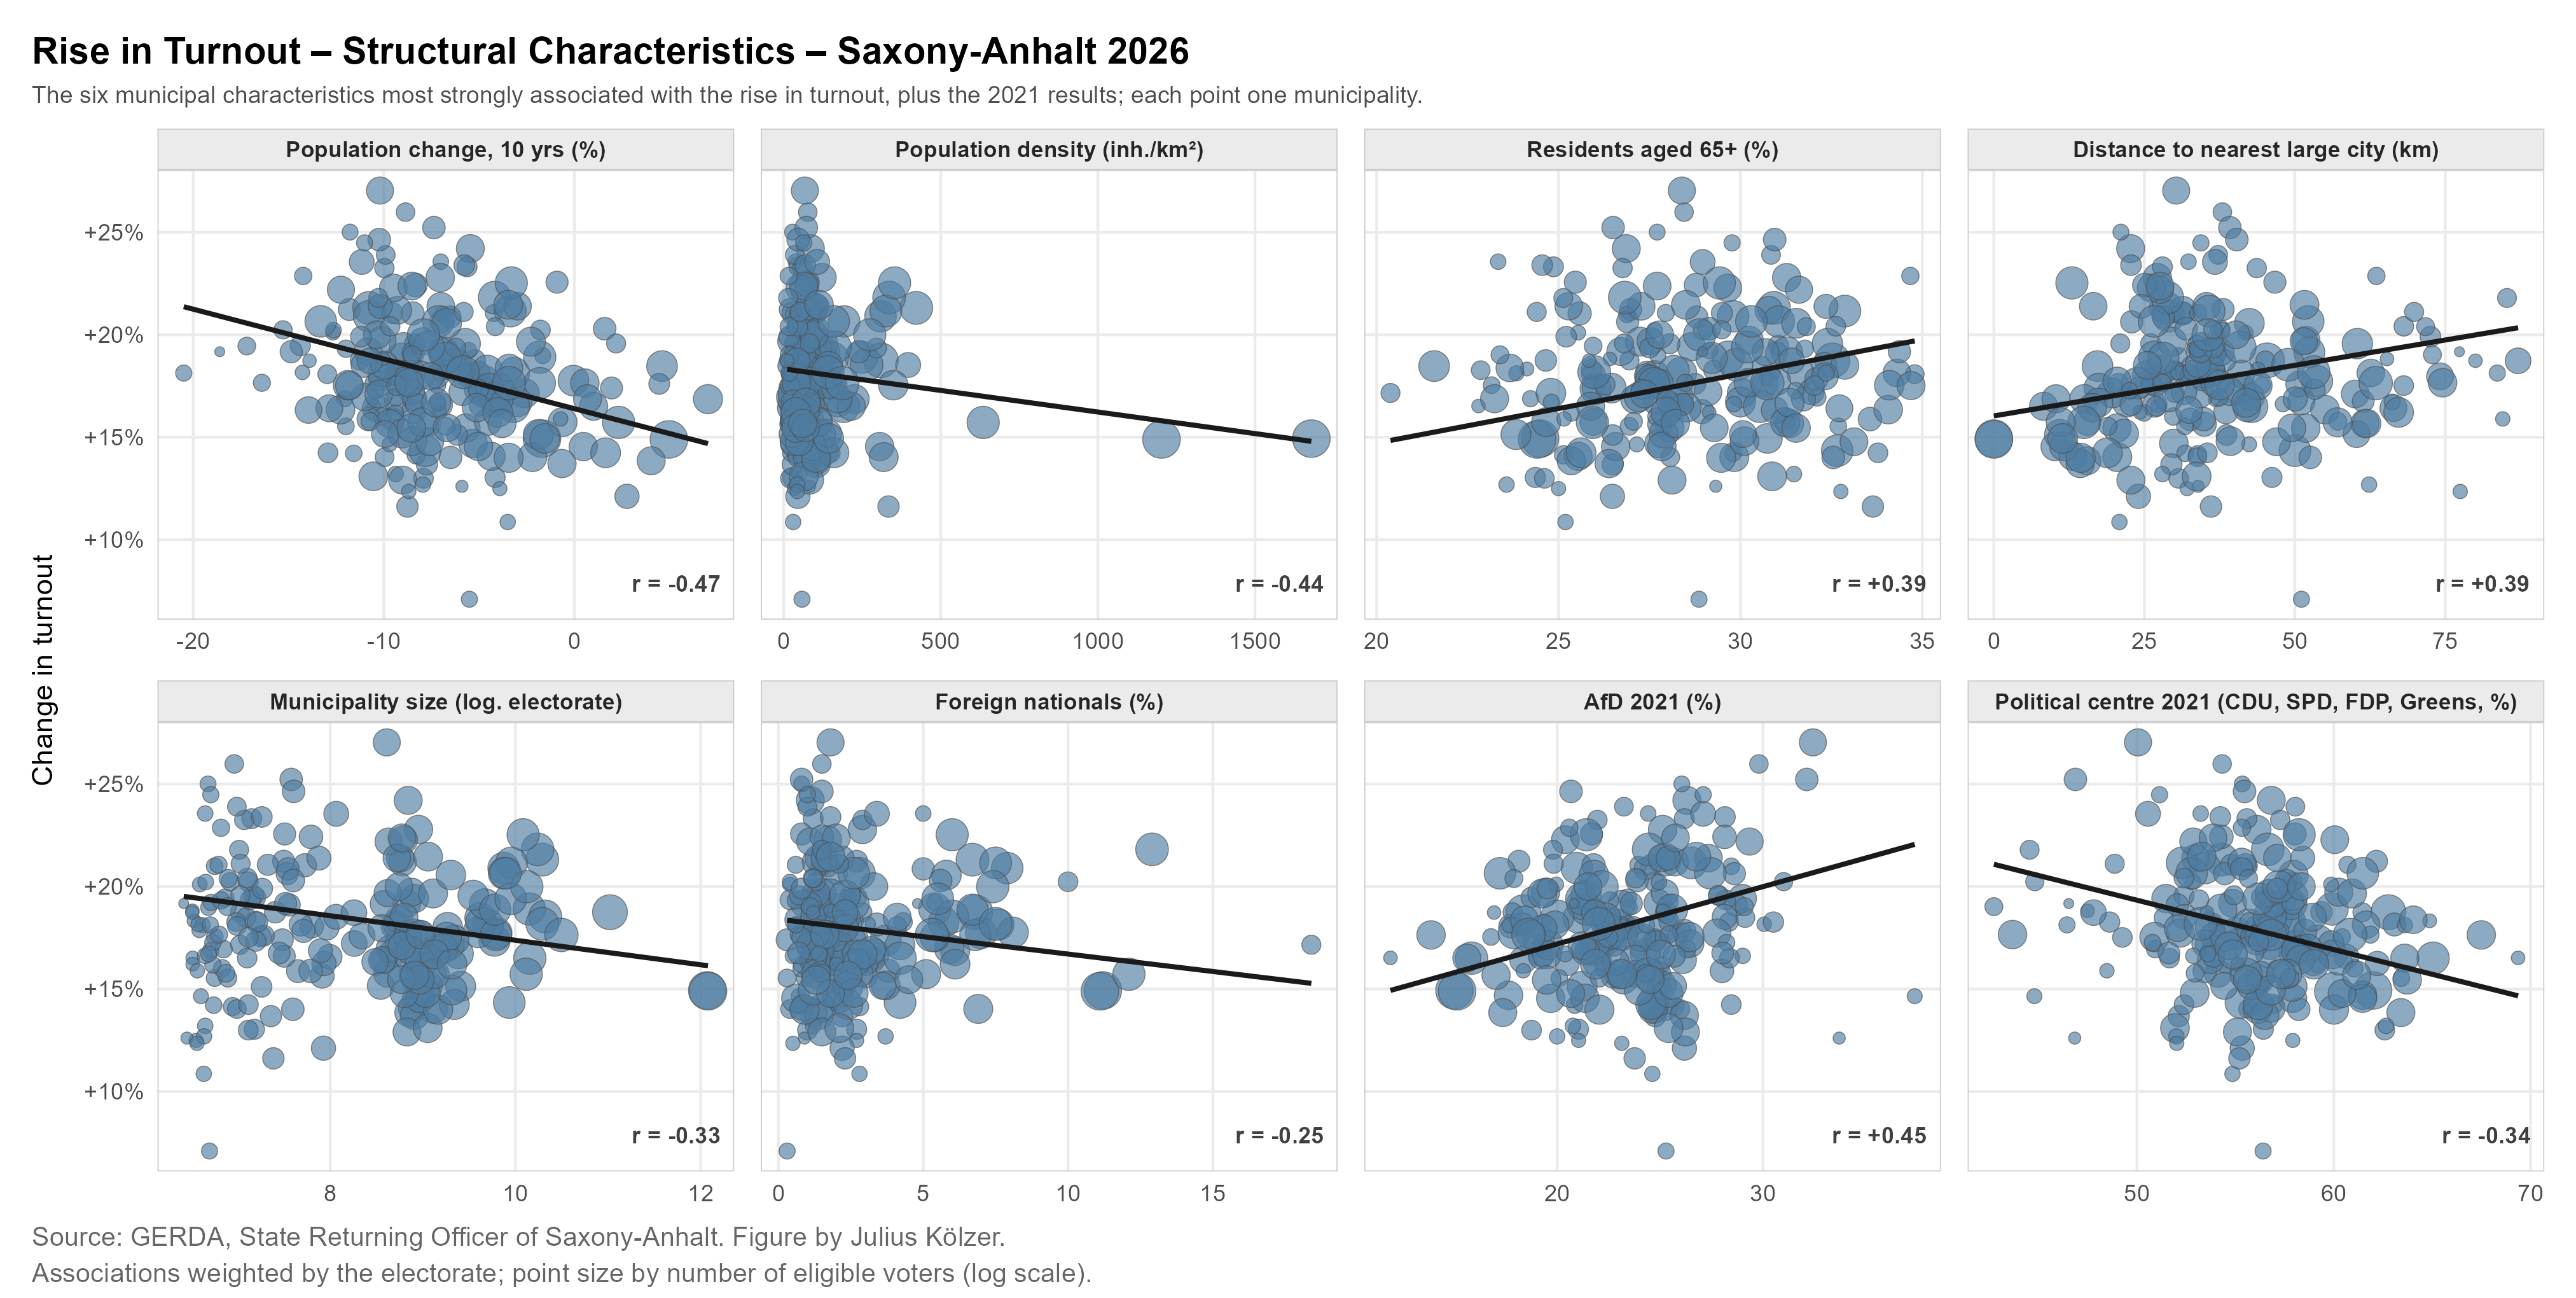
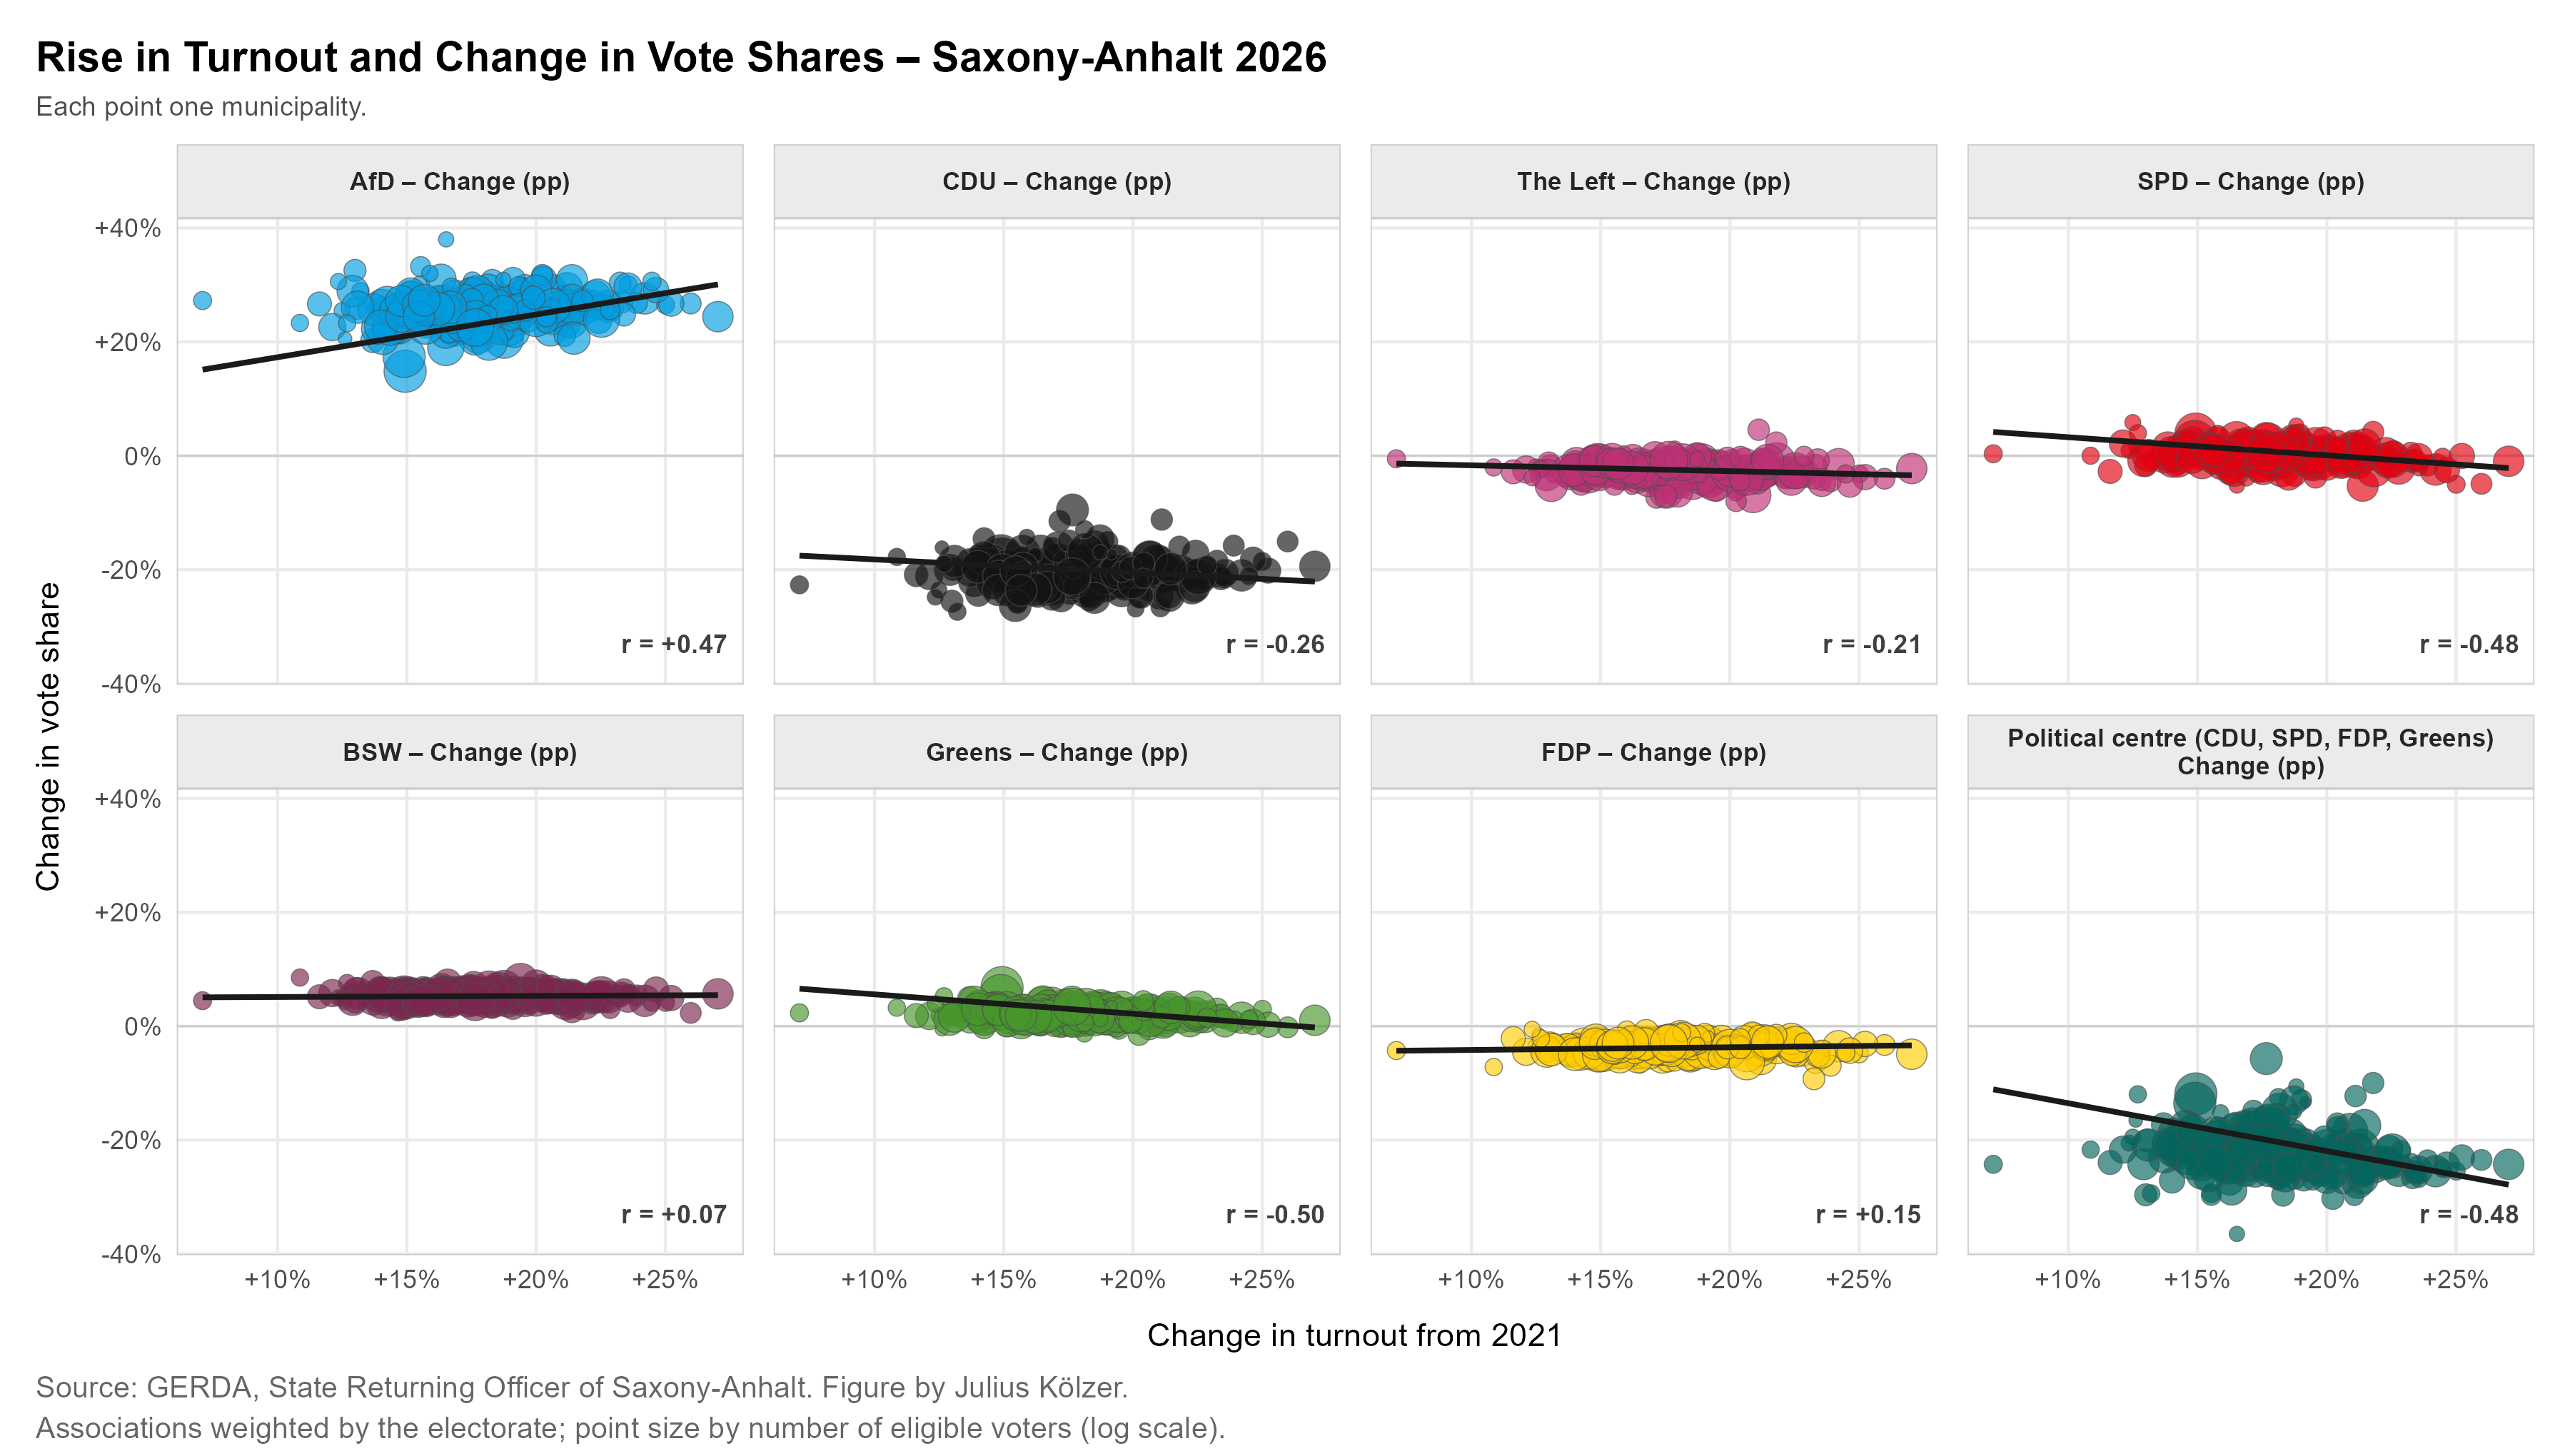
The strong rise in turnout in rural areas is also visible in the scatterplots displayed below. Larger increases in turnout are associated with greater rurality, reflected in lower population density and smaller population size. Turnout also tends to rise more strongly in municipalities with greater population loss and a more peripheral location. Moreover, turnout rose most where the AfD had already performed above average in 2021. Conversely, the increase tends to be smaller in regions where the parties of the political centre were more firmly anchored.
Mobilising Former Non-Voters
The largely partisan nature of the turnout increase was already evident on election night. The AfD, in particular, proved highly effective at mobilising former non-voters. With a net gain of around 170,000 votes from previous non-voters, its mobilisation effect was almost twice as large as that of all other parties combined.
This pattern is not new, however (cf. Schäfer 2024; Vehrkamp/Wegschaider 2017). The AfD’s particular capacity to mobilise groups that had previously abstained from voting has been well documented in the literature since the 2017 federal election at the latest (cf. Hansen/Olsen 2019; Immerzeel/Pickup 2015). The electoral mobilisation of these groups is often associated with political alienation, lower levels of trust in political institutions, and socio-economic and spatial inequalities (cf. Deppisch et al. 2019; Förtner et al. 2021; Schulte-Cloos/Leininger 2022). In structurally weaker regions in particular, such perceptions of political and social marginalisation can become spatially concentrated (cf. Deppisch/Klärner 2025; Schäfer 2024). In many rural parts of Saxony-Anhalt, where turnout has now risen particularly strongly, participation had fallen to barely 40 per cent during the 2000s.
Who Benefits from the Extra Votes
The municipality-level analyses confirm the AfD’s mobilisation gains. The increase in the AfD’s vote share since 2021 correlates much more strongly with the rise in turnout than the changes in the other parties’ vote shares. For the combined vote share of the parties of the political centre – CDU, SPD, Greens and FDP – the relationship is even negative: the more turnout rose, the larger their losses compared with the previous state election.1
2. The AfD Dominates Rural Saxony-Anhalt
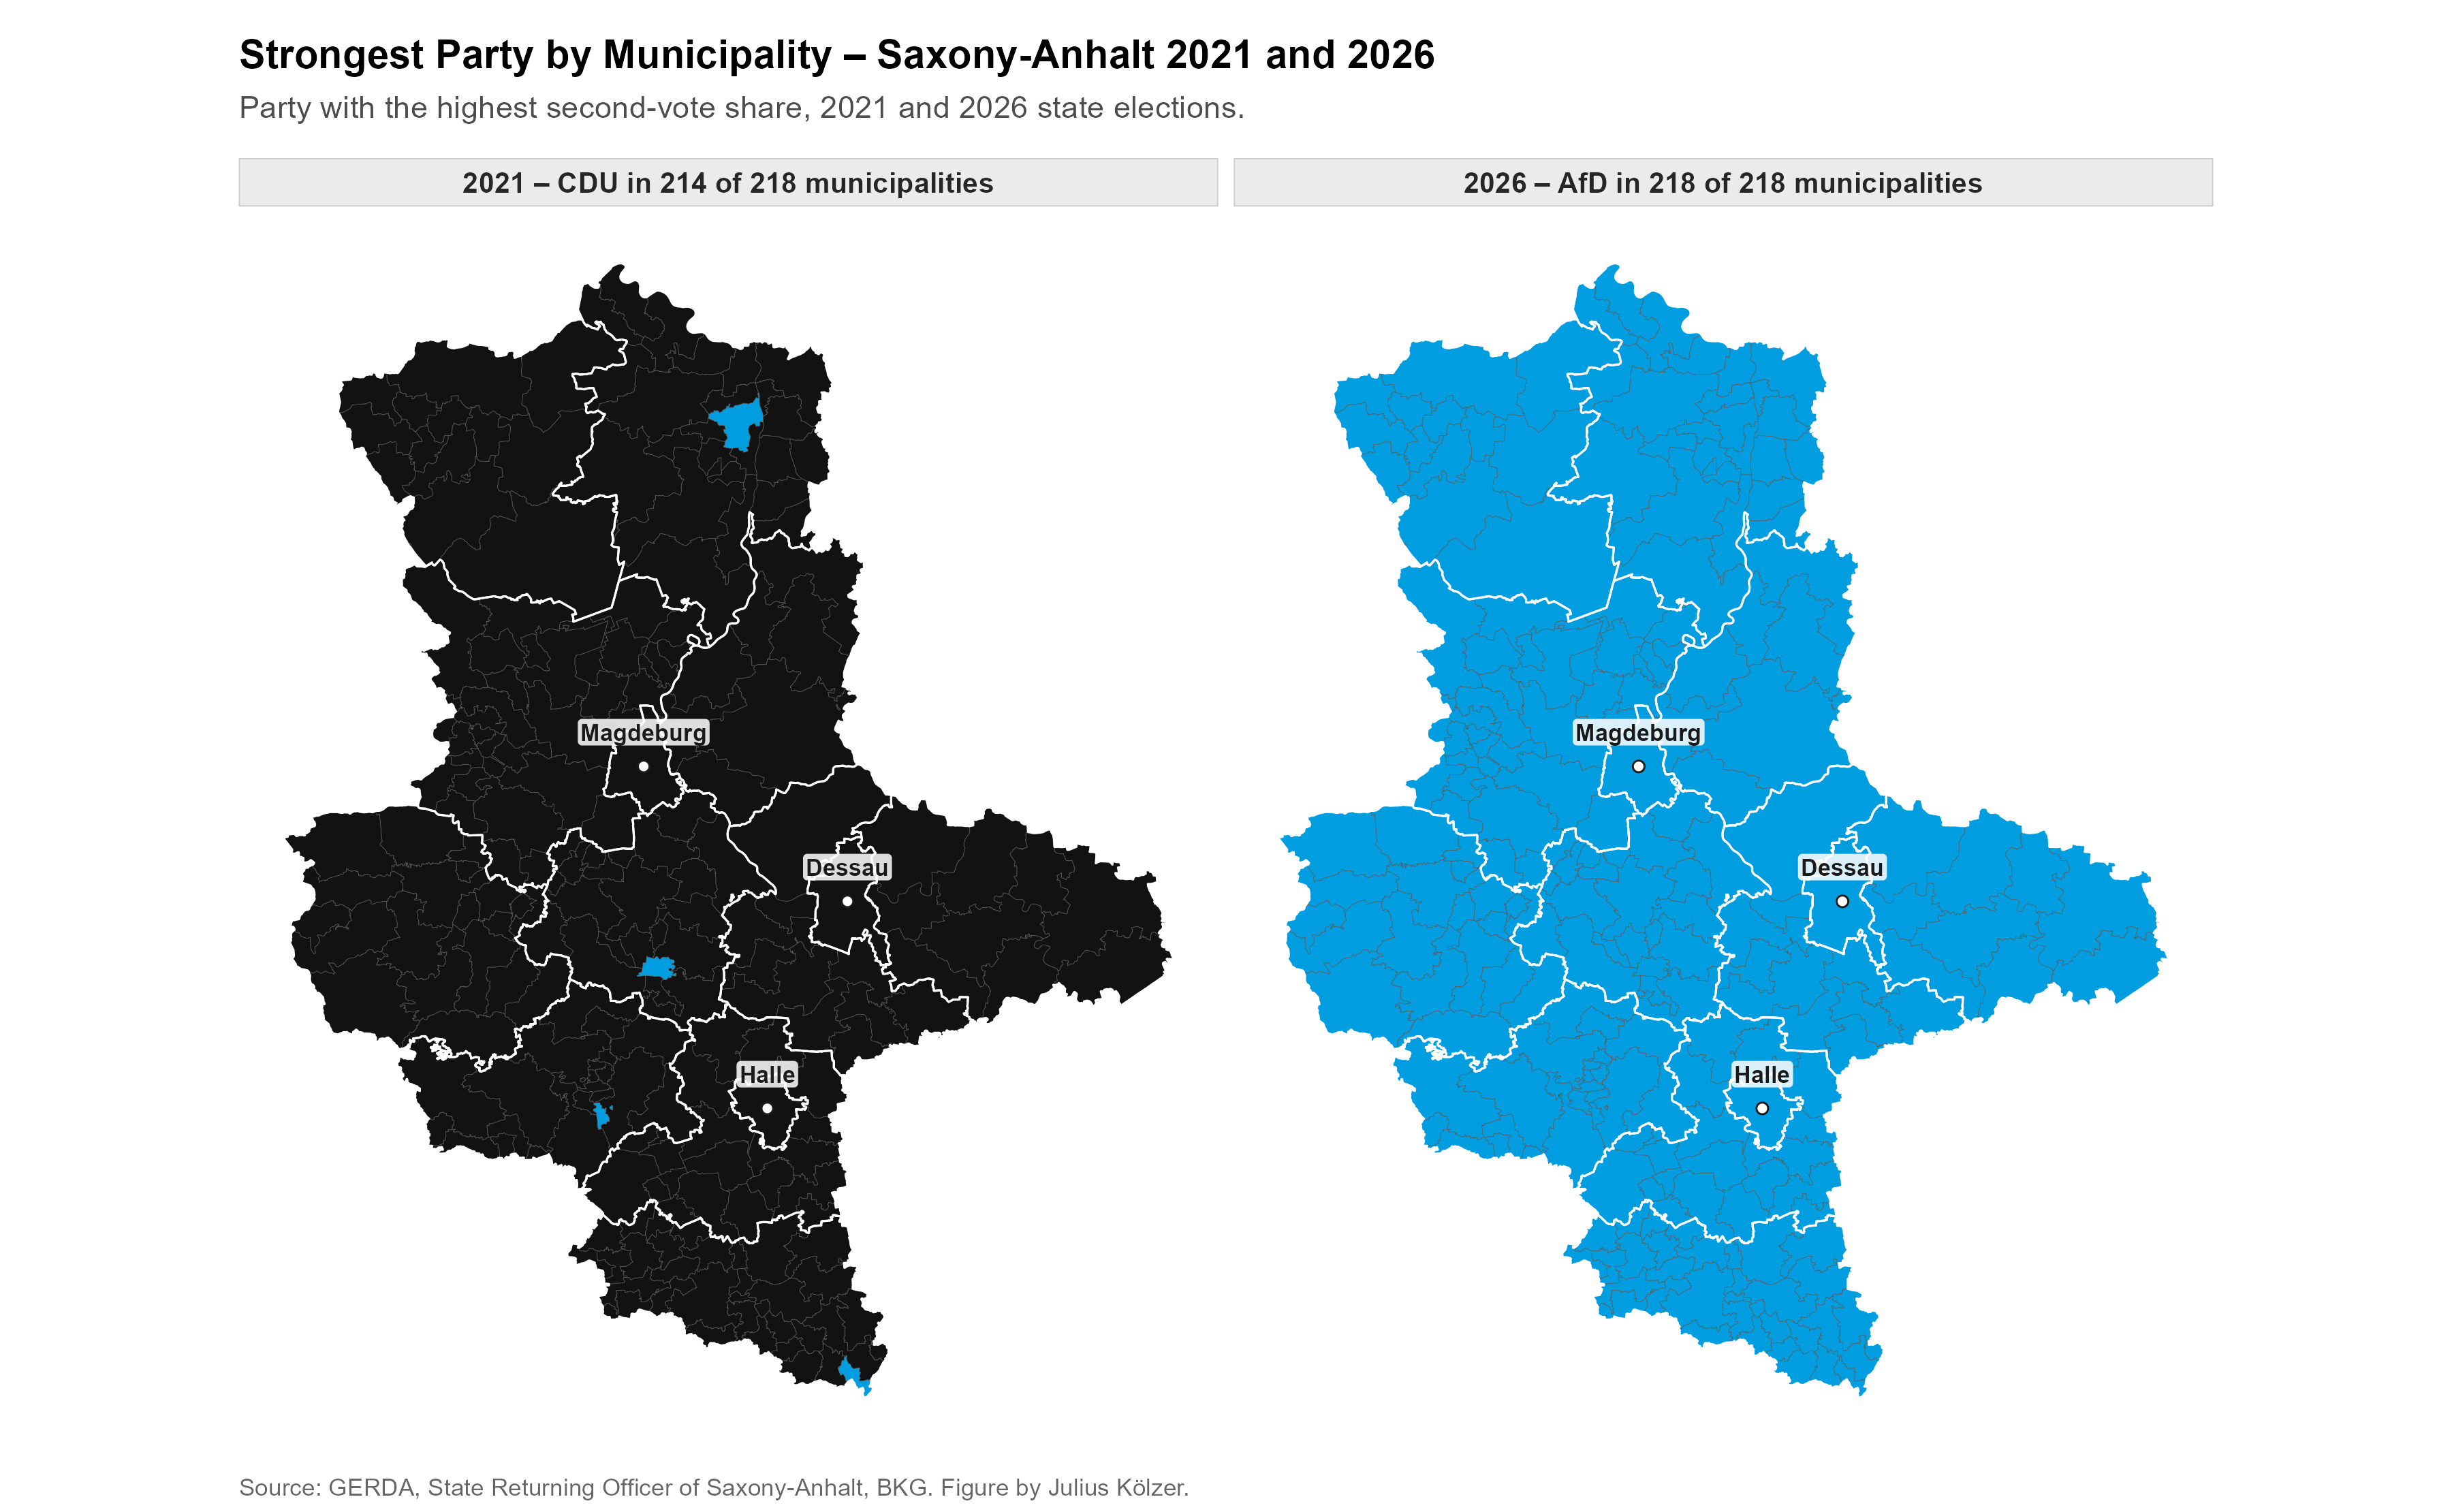
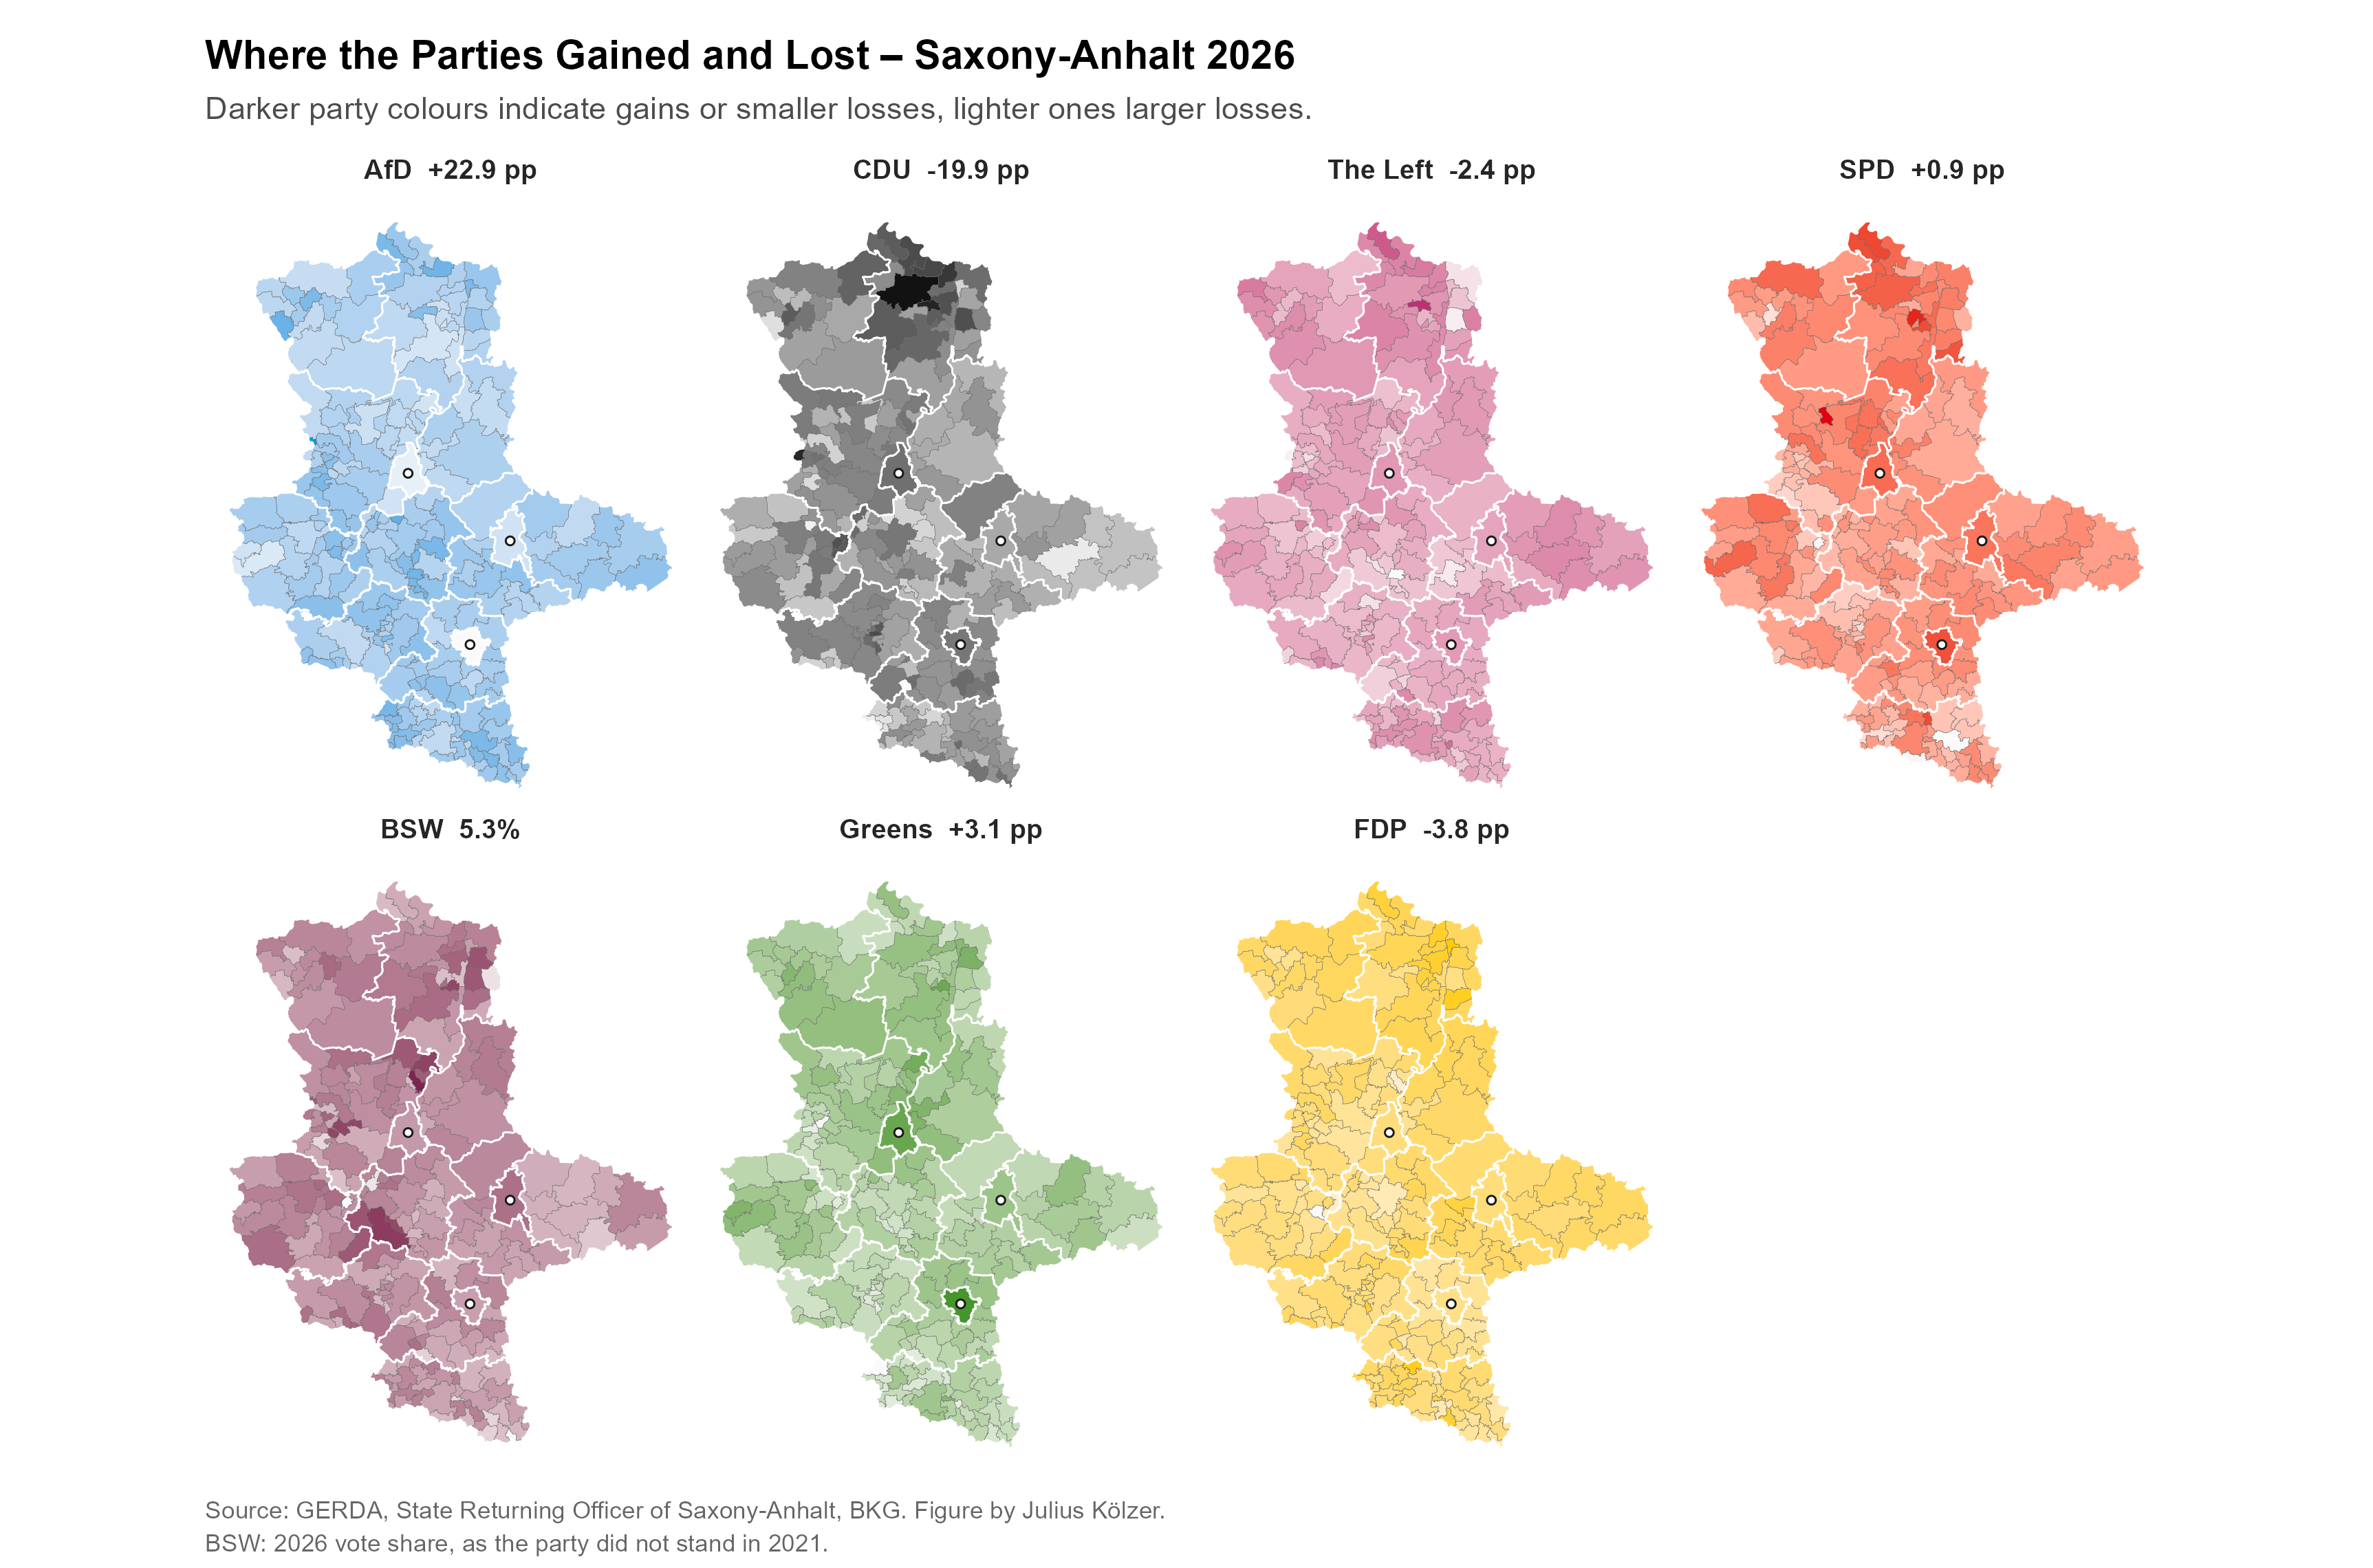
The AfD became the strongest party in every municipality largely by mobilising former non-voters in rural areas. The electoral map shifted from CDU dominance in 2021 to AfD dominance in 2026. In 2021, the CDU was the strongest party in 214 of 218 municipalities; in 2026, the AfD leads in all 218. The AfD’s largest gains are concentrated in the south and centre of Saxony-Anhalt, including the Burgenlandkreis and Saalekreis. Its gains are markedly smaller in Halle, Magdeburg, and Wernigerode. The CDU loses ground across the state, with its largest declines in Wittenberg, Dessau-Roßlau and its former rural heartland Jerichower Land, and Burgenlandkreis. It performs comparatively better in the Altmark, the district of Stendal, and the two largest cities. The SPD and The Left display a similarly more urban electoral profile: both perform relatively better in Halle, Magdeburg, and parts of the north, while The Left records its largest losses in Mansfeld-Südharz, Anhalt-Bitterfeld, and Salzlandkreis. The Greens gain primarily in Halle and Magdeburg, with much weaker increases in the south; the BSW, by contrast, shows a relatively even spatial distribution, with somewhat stronger results in Dessau-Roßlau, Stendal, the Harz, and Salzlandkreis.
Town vs. Country
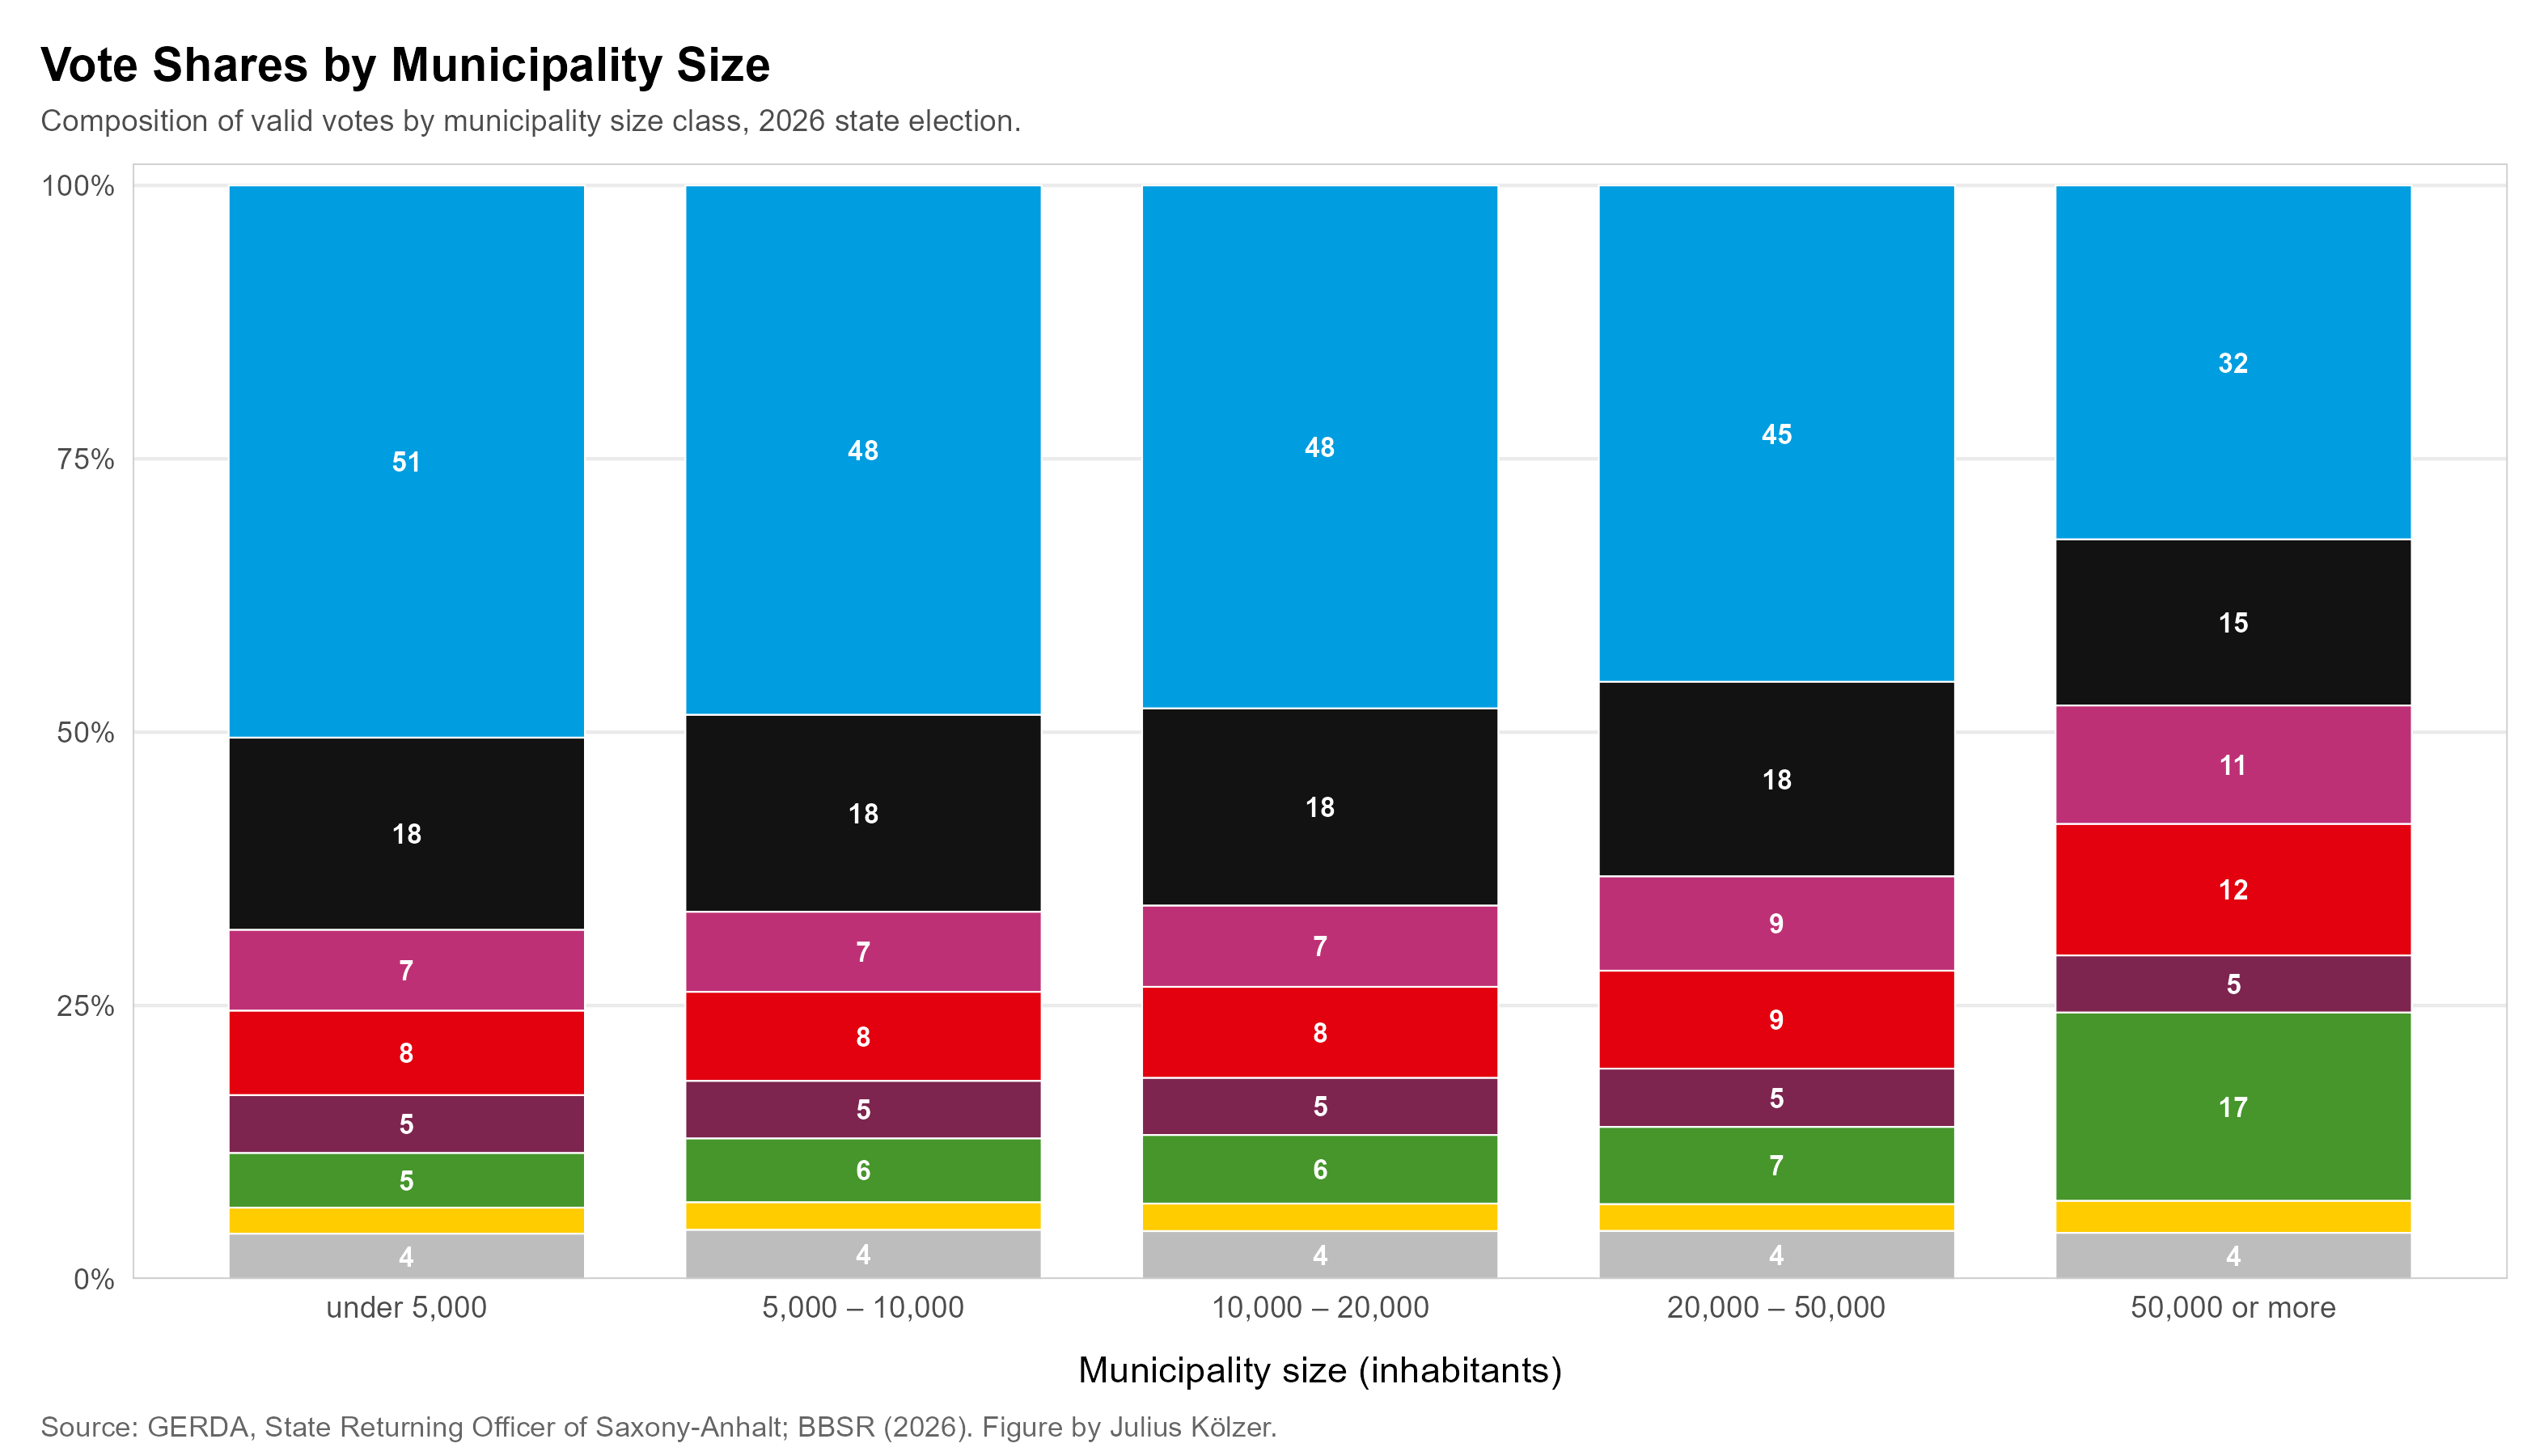
Despite these regional differences, the clearest electoral divide runs between the state’s three larger cities and the rest of Saxony-Anhalt. Across the countryside, the AfD remains dominant even in municipalities with 20,000 to 50,000 inhabitants, while the other parties perform considerably worse on average. In municipalities with fewer than 5,000 inhabitants, the AfD reaches as much as 51 per cent of the vote, and even in mid-sized municipalities with 20,000 to 50,000 inhabitants, it still receives 45 per cent. Only in Halle, Magdeburg, and Dessau-Roßlau does its vote share fall markedly, to 32 per cent. At the same time, the Greens in particular, at 17 per cent, but also the SPD and The Left, perform substantially better there than in smaller municipalities. The CDU remains comparatively stable across municipality size categories, losing some ground only in the largest category. Overall, the electoral profile of the three larger cities differs markedly from that of the rest of the state. These patterns are not new. The urban-rural divide in voting behaviour is particularly pronounced in eastern Germany, not least because of the stark demographic contrast between urban and rural areas (cf. Haffert 2022; Haffert/Mitteregger 2023; Kröhnert/Vollmer 2012; Leibert 2016; Deppisch/Klärner 2025).
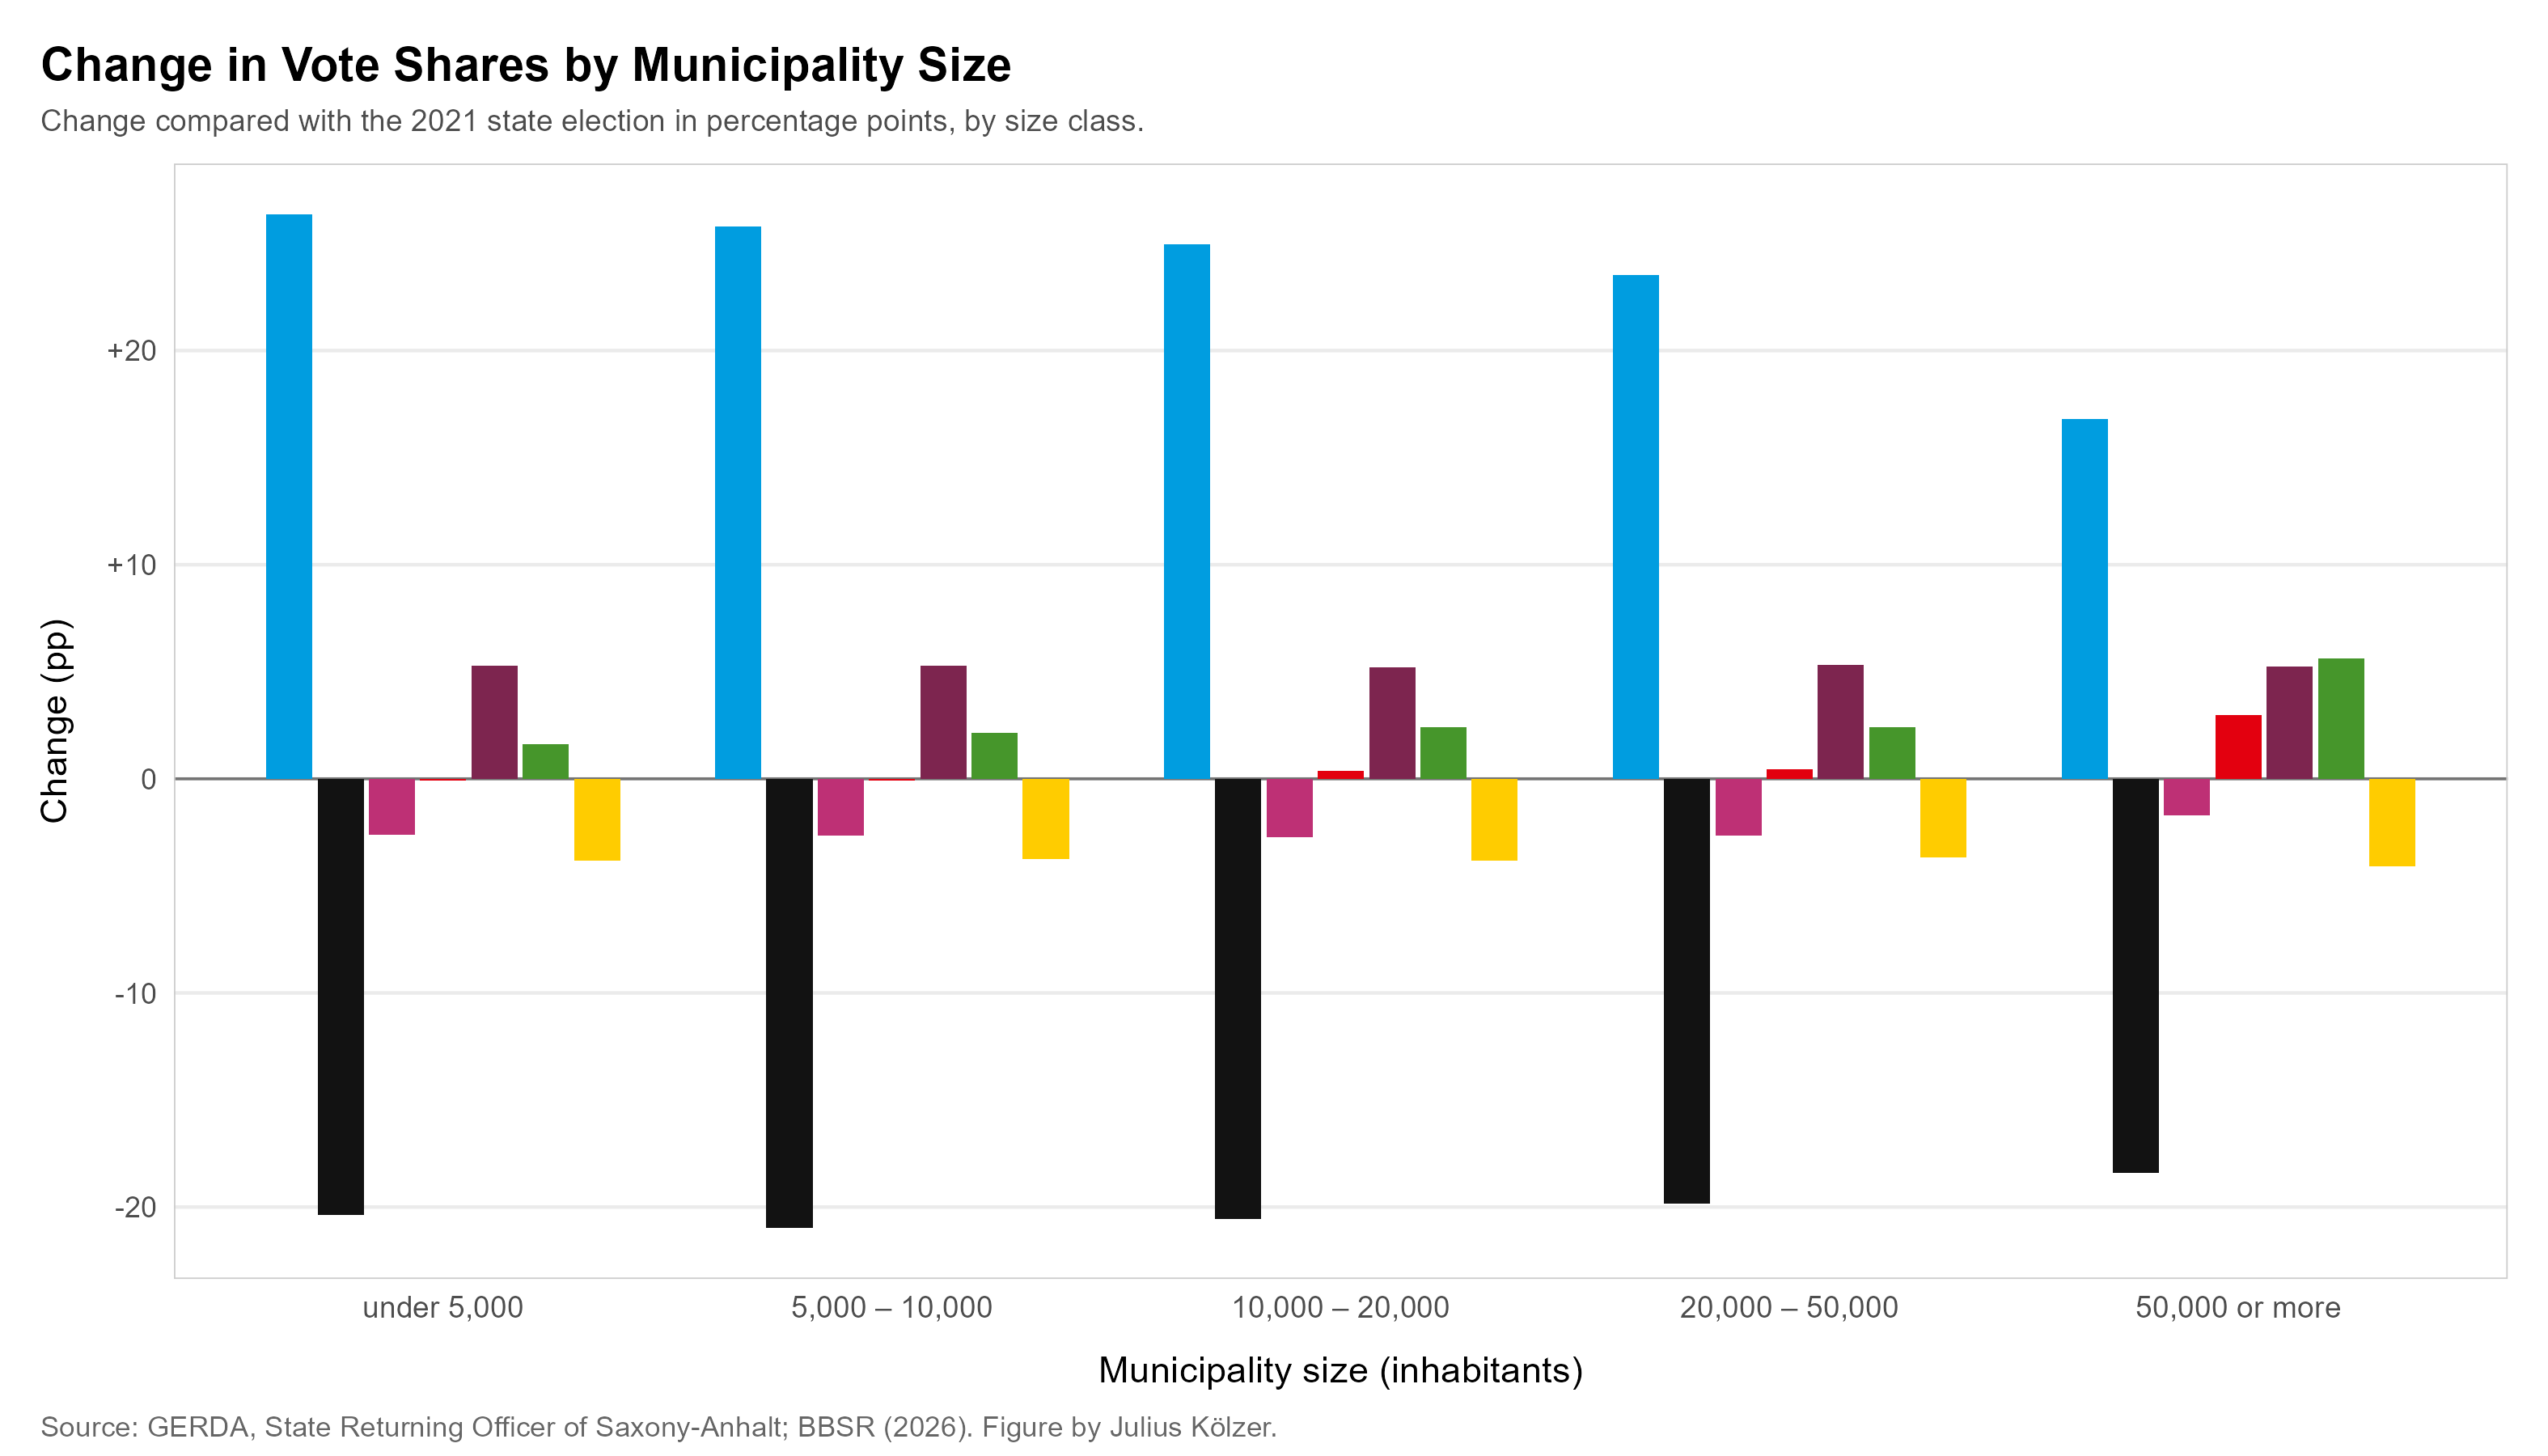
The change in vote shares across the size classes also underlines the AfD’s growing dominance in rural areas. The smaller the municipality, the larger its gains. The SPD and the Greens, by contrast, gain mainly in the larger and more urban municipalities. The Left’s losses are also much smaller there than in smaller municipalities. This reflects the stronger urbanisation of their electorates that was already visible at the 2025 federal election – which, in a predominantly rural state like Saxony-Anhalt, meets difficult structural conditions.
3. What the Parties’ Strongholds Look Like
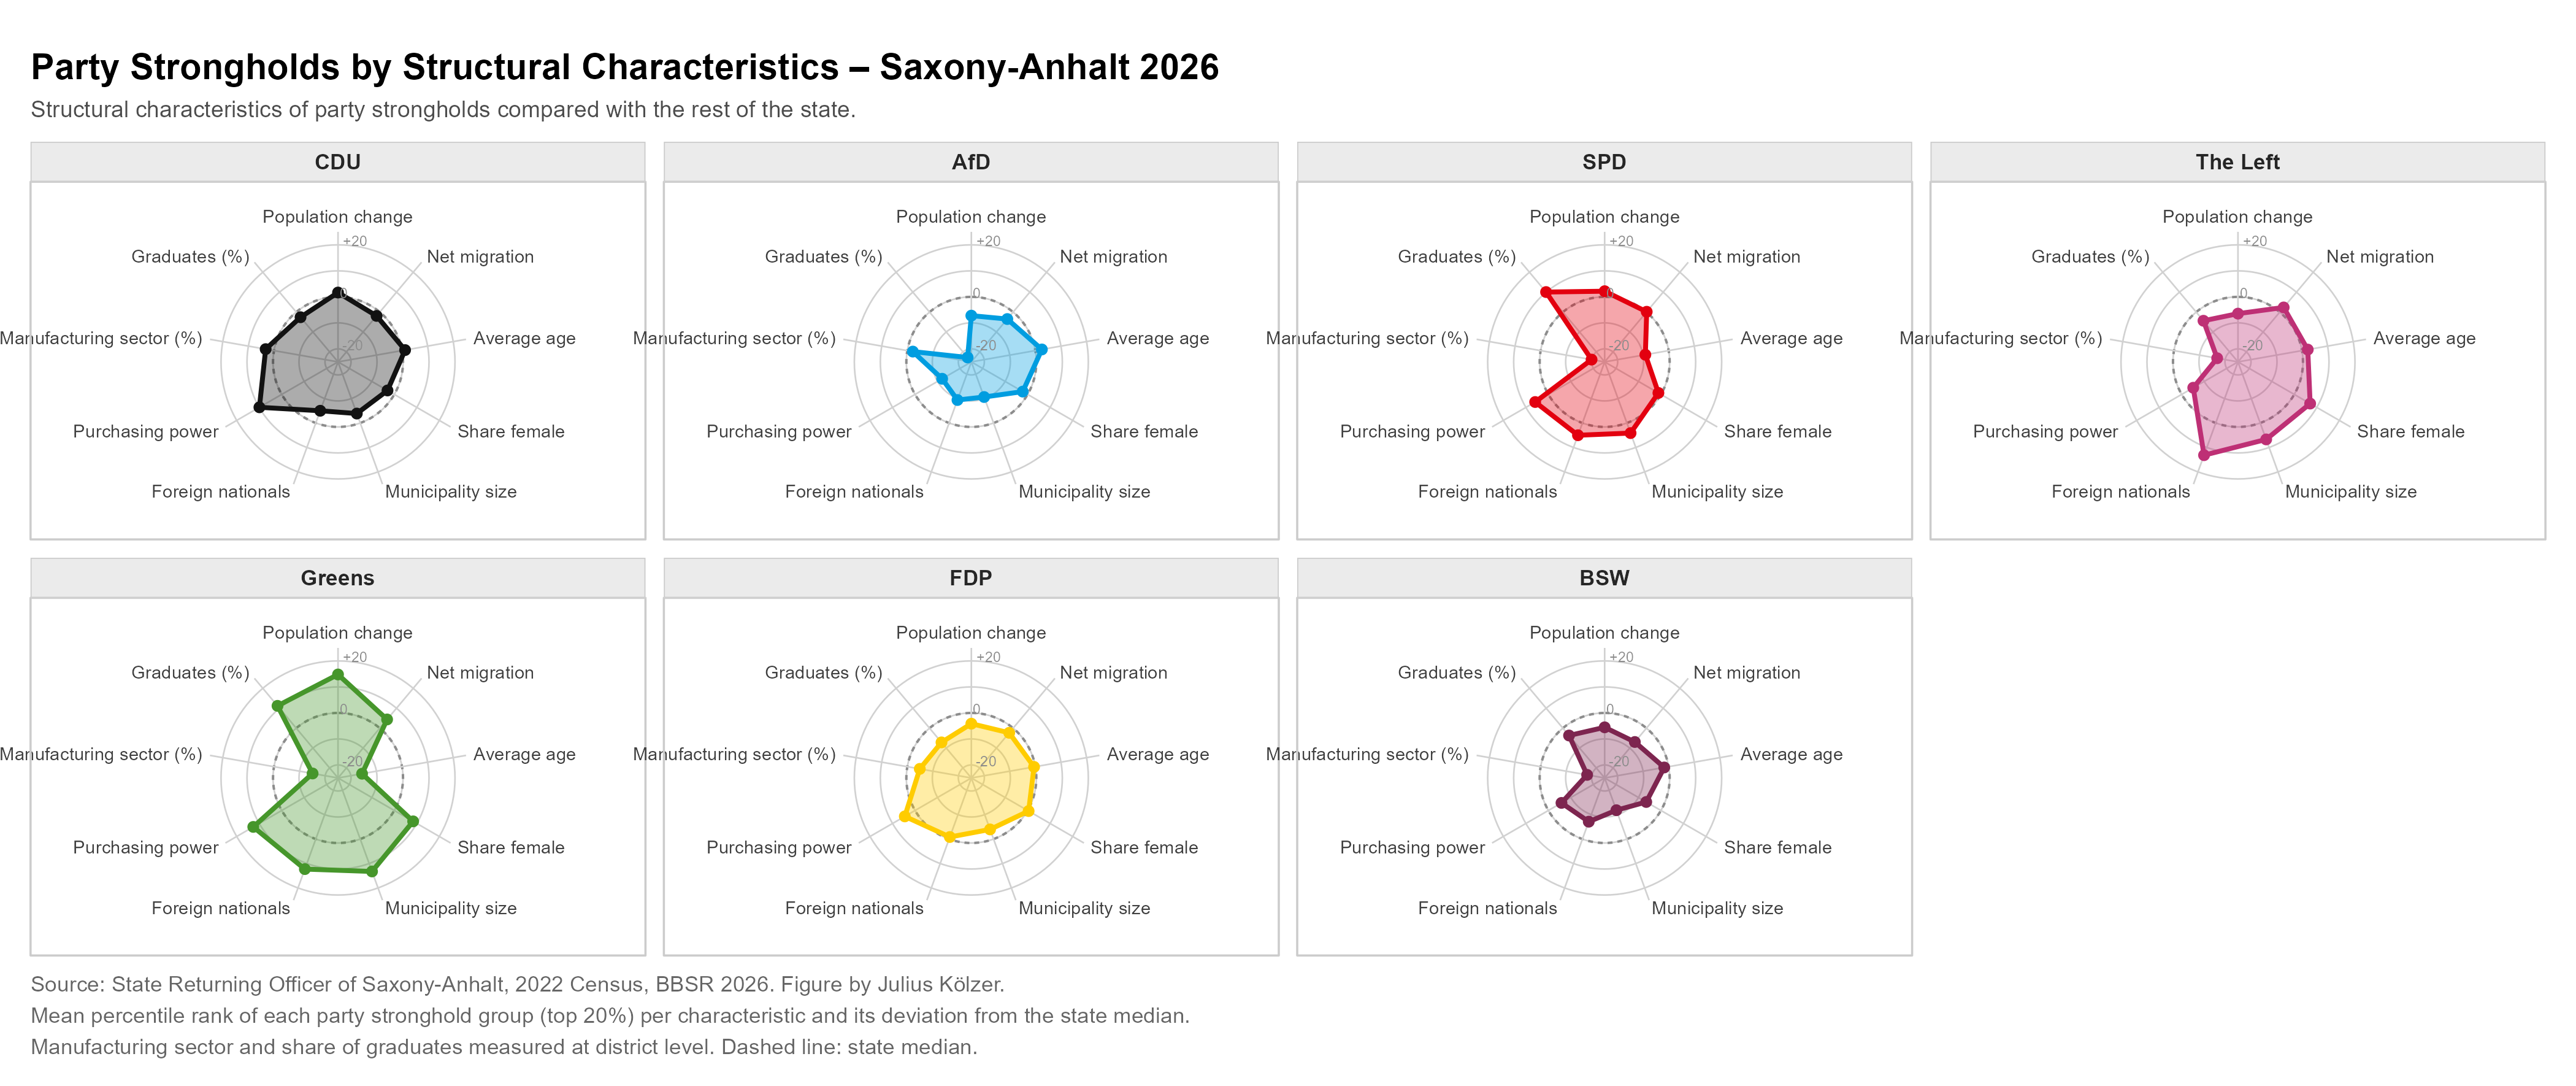
The parties’ distinct geographic support bases are also reflected in a range of local structural characteristics. The AfD displays the clearest pattern: its strongholds are disproportionately located in smaller municipalities characterised by more negative population trends, higher levels of out-migration, and older populations. At the same time, these municipalities tend to have lower shares of university graduates, foreign nationals, and women, as well as lower purchasing power, while employment in manufacturing is above the state median. The structural profile of municipalities with particularly high AfD vote shares therefore broadly corresponds to patterns identified in previous research (cf. Höhne et al. 2025; Schütze 2023; Kröhnert/Vollmer 2012; Leibert 2016). High levels of AfD support are frequently concentrated in areas characterised by socio-economic weakness, demographic decline, and other forms of local relative deprivation (cf. Greve et al. 2023; DIW Berlin 2026; Bayerlein et al. 2026). These patterns are also consistent with earlier analyses at the constituency and municipal levels (cf. Franz et al. 2018; Höhne et al. 2025; Bayerlein et al. 2026; Lux 2018; Rippl/Seipel 2018; Bergmann et al. 2017; Goerres et al. 2018).
The Greens exhibit an almost inverse geographic support base. Their strongest municipalities are larger, experience stronger population growth, and have more positive migration balances; they also have above-average shares of university graduates and residents without German citizenship. Lower average age and a higher share of women further underscore the distinctly urban profile of Green support. The SPD likewise performs better in growing municipalities with higher shares of graduates and greater purchasing power, although its geographic profile is less sharply differentiated overall. The political geography of Saxony-Anhalt therefore partly reflects the spatial patterns discussed in the literature under the heading of the “geography of discontent” (cf. Rodríguez-Pose 2018; Dijkstra et al. 2020; for Germany Greve et al. 2023; Förtner et al. 2021).
For The Left, by contrast, the data point to an overlap between older and newer components of its electorate. On the one hand, its strongholds are more often found in larger municipalities with higher shares of foreign nationals and women, as well as more positive migration balances, all of which are characteristic of a more urban electorate. On the other hand, weaker population growth and a comparatively higher average age remain visible, indicating the continued importance of older East German voter groups. The formative role of the post-1990 transformation experience for this generation has been documented extensively in the literature (cf. Mau 2019, 2024; Mau et al. 2023; Holtmann et al. 2014). The CDU and FDP lie closer to the state median across many structural characteristics and therefore have less distinctive geographic support bases. The BSW, in turn, partly resembles the AfD in terms of municipality size, population change, and average age, though these similarities are considerably less pronounced (cf. Thomeczek 2025; Heckmann et al. 2025; Höhne et al. 2025).
4. The Parties One by One
AfD
The final section examines more closely how these structural characteristics relate to the parties’ geographic support bases and their change relative to 2021. For the AfD, previous research, particularly on eastern Germany, points to a substantial degree of spatial continuity with the earlier electoral geography of right-wing extremist parties. The party has been particularly successful in mobilising voters in local communities where electoral preferences for right-wing extremist parties had already been present in the 1990s and 2000s (cf. Cantoni et al. 2019; Weisskircher 2020; Heinze et al. 2026; Kölzer et al. 2025; Schulte-Cloos 2022). Saxony-Anhalt is a particularly instructive case in this regard: as early as 1998, the DVU entered the state parliament with 12.9 per cent of the vote, while in 2011 the NPD only narrowly failed to cross the electoral threshold.
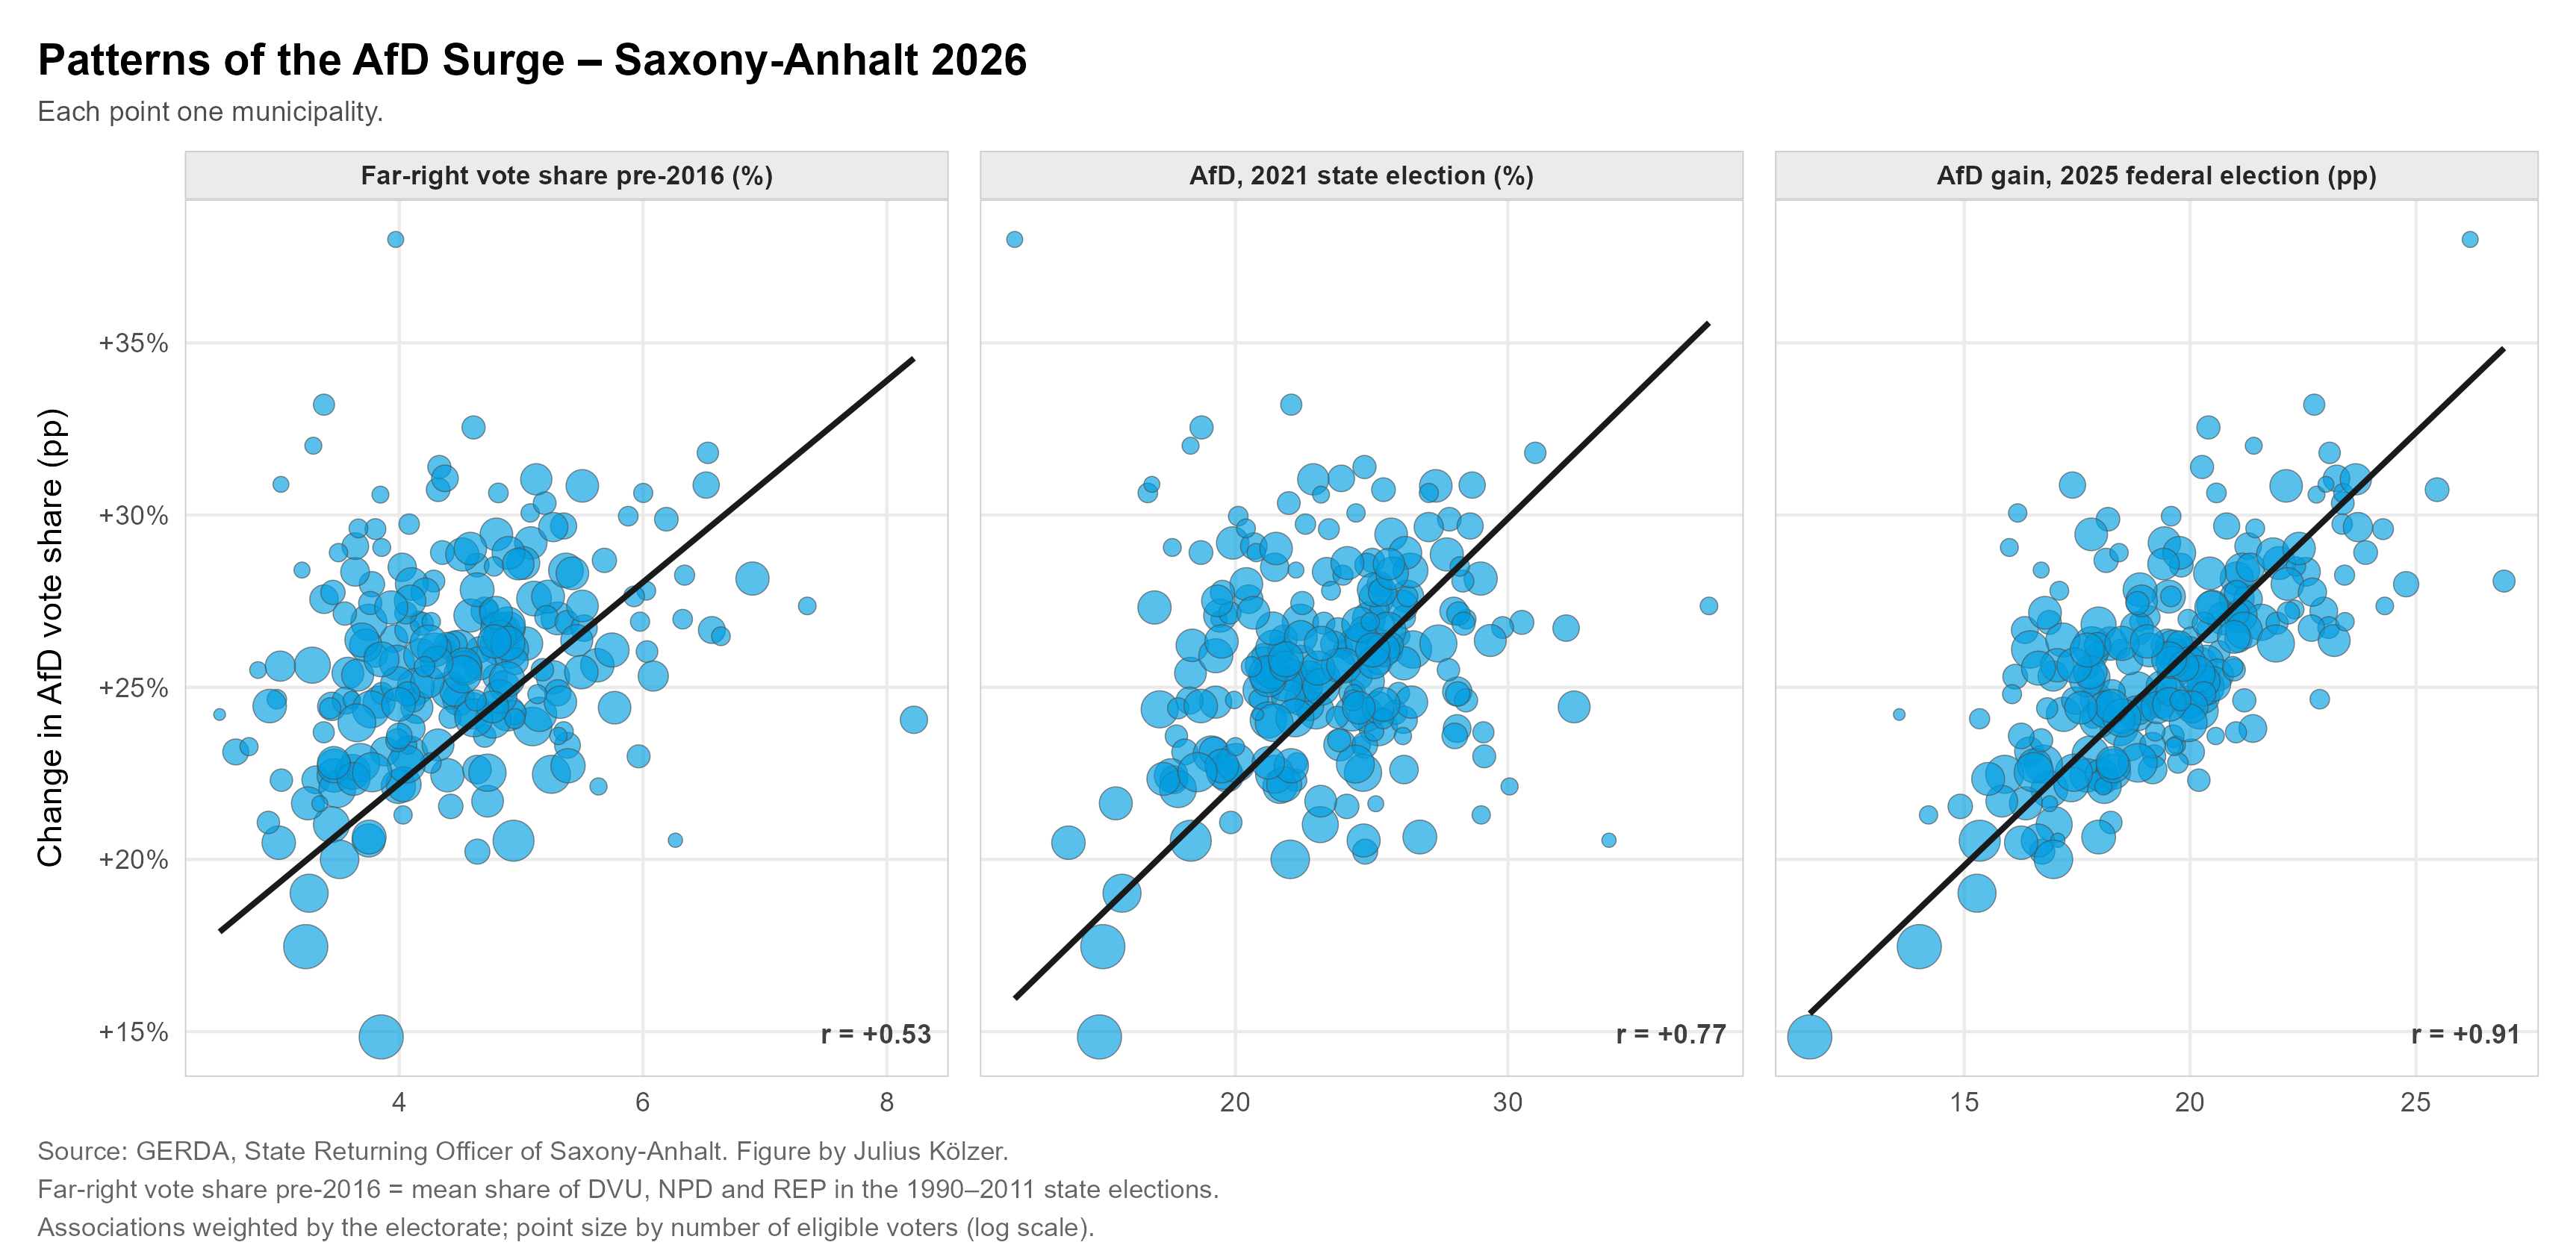
The current election likewise reveals a clear municipality-level association between historical support for far-right parties and the AfD’s present-day electoral strength. At the same time, the magnitude of this relationship has declined noticeably over time. In 2016, earlier vote shares of the DVU, NPD, and other far-right parties were a substantially stronger predictor of AfD support than in 2026, as indicated by the declining correlation coefficient. This suggests that the AfD’s geographic support base has increasingly expanded beyond the former strongholds of organised right-wing extremism. The party now achieves high vote shares in municipalities where far-right parties had previously remained comparatively weak. This pattern may therefore be interpreted as evidence of broader spatial diffusion of AfD support. Its electoral base is now less strongly confined to the milieus and localities that had already exhibited a pronounced far-right voting tradition prior to the party’s rise. This is consistent with findings on the changing composition of the AfD electorate and the party’s increasing electoral consolidation in eastern Germany (cf. Hansen/Olsen 2019; Arzheimer/Berning 2019; Pesthy et al. 2021; Heinze et al. 2026; Weisskircher 2020).
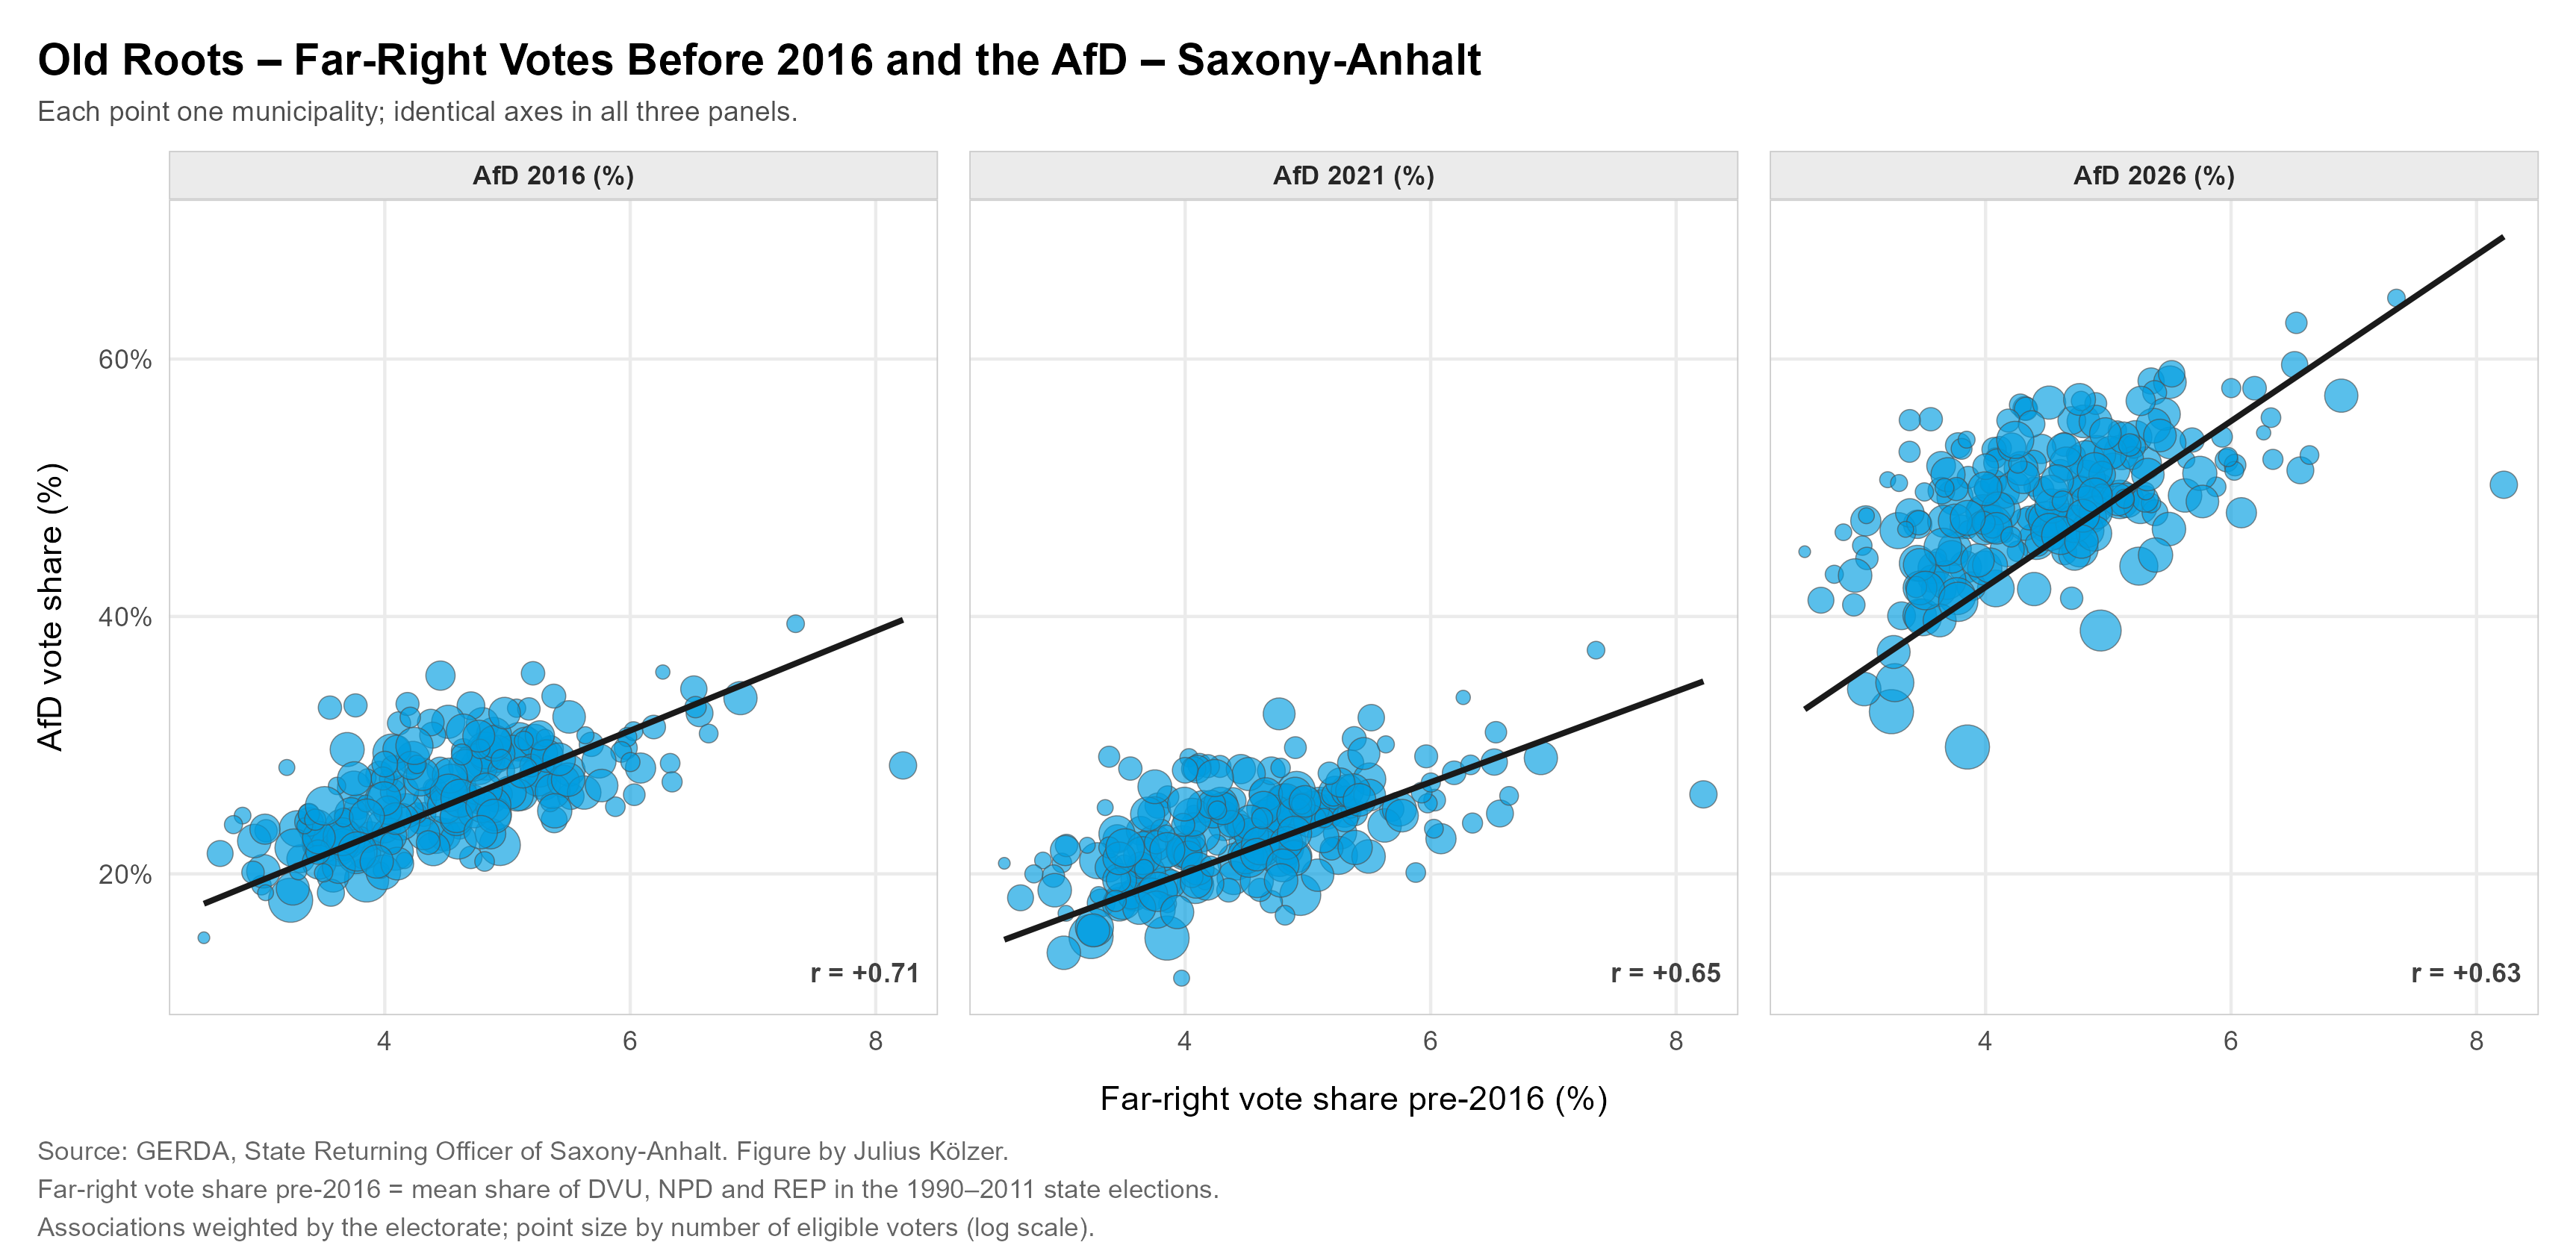
A look at the AfD’s gains also shows that its growth is no longer confined to the former strongholds of far-right parties. The increase does tend to be larger where the DVU, NPD, and Republikaner had already achieved higher vote shares before 2016,2 but the correlation is only moderate. The AfD’s gains therefore by no means stem exclusively from former strongholds of right-wing extremism. The party continues to gain most where it is already electorally anchored, yet it also grows substantially outside its previous strongholds. This broader geographic diffusion is consistent with a process of electoral normalisation, in which AfD support becomes less confined to areas with an established far-right voting tradition. The strongest relationship, finally, is with the gains recorded in the 2025 federal election. This suggests that the 2026 result follows less the older geography of right-wing extremism than the more recent spatial dynamics of the AfD’s own electoral expansion.
Finally, the relationships outlined above between local structural characteristics and party support are assessed jointly in multivariate regression models. For each party, two separate OLS models with standardised variables are estimated: one models the 2026 vote share, while the other models the change in vote share relative to the 2021 state election. The reported coefficients therefore capture the conditional association between each structural characteristic and the respective electoral outcome, holding the other covariates in the model constant.3
A methodological note is warranted before turning to the results. All analyses in this piece rely on aggregate data: election results and structural characteristics are observed for Saxony-Anhalt’s 218 municipalities rather than for individual voters. The estimated relationships therefore capture variation across municipalities in party support and electoral change, not individual-level voting behaviour. If the AfD performs better in municipalities with higher unemployment, for example, this does not imply that unemployed individuals are more likely to vote for the party. Inferring individual-level behaviour from aggregate-level relationships would constitute the classic ecological fallacy (cf. Robinson 1950; King 1997; Lengfeld 2017; Lux 2018; Rippl/Seipel 2018).
For the AfD, the model of the 2026 vote share continues to show a positive and significant association with earlier support for far-right parties. Higher unemployment is likewise associated with stronger AfD support, whereas larger municipality size and higher purchasing power are also weakly associated with lower vote shares. This pattern is consistent with established findings on the party’s relative strength in rural areas and in regions characterised by local labour-market deprivation. The picture is less clear when modelling gains since 2021. AfD gains display considerably weaker associations with the spatial and structural characteristics included in the models, likely reflecting the fact that the party gained substantially across almost all municipalities. Significantly larger gains are concentrated primarily in smaller municipalities and in places with lower shares of women and lower purchasing power. Earlier support for far-right parties also remains positively associated with AfD gains, although the relationship is now only weakly significant. By contrast, the municipal share of foreign nationals is significantly associated with neither overall AfD support nor gains since 2021.
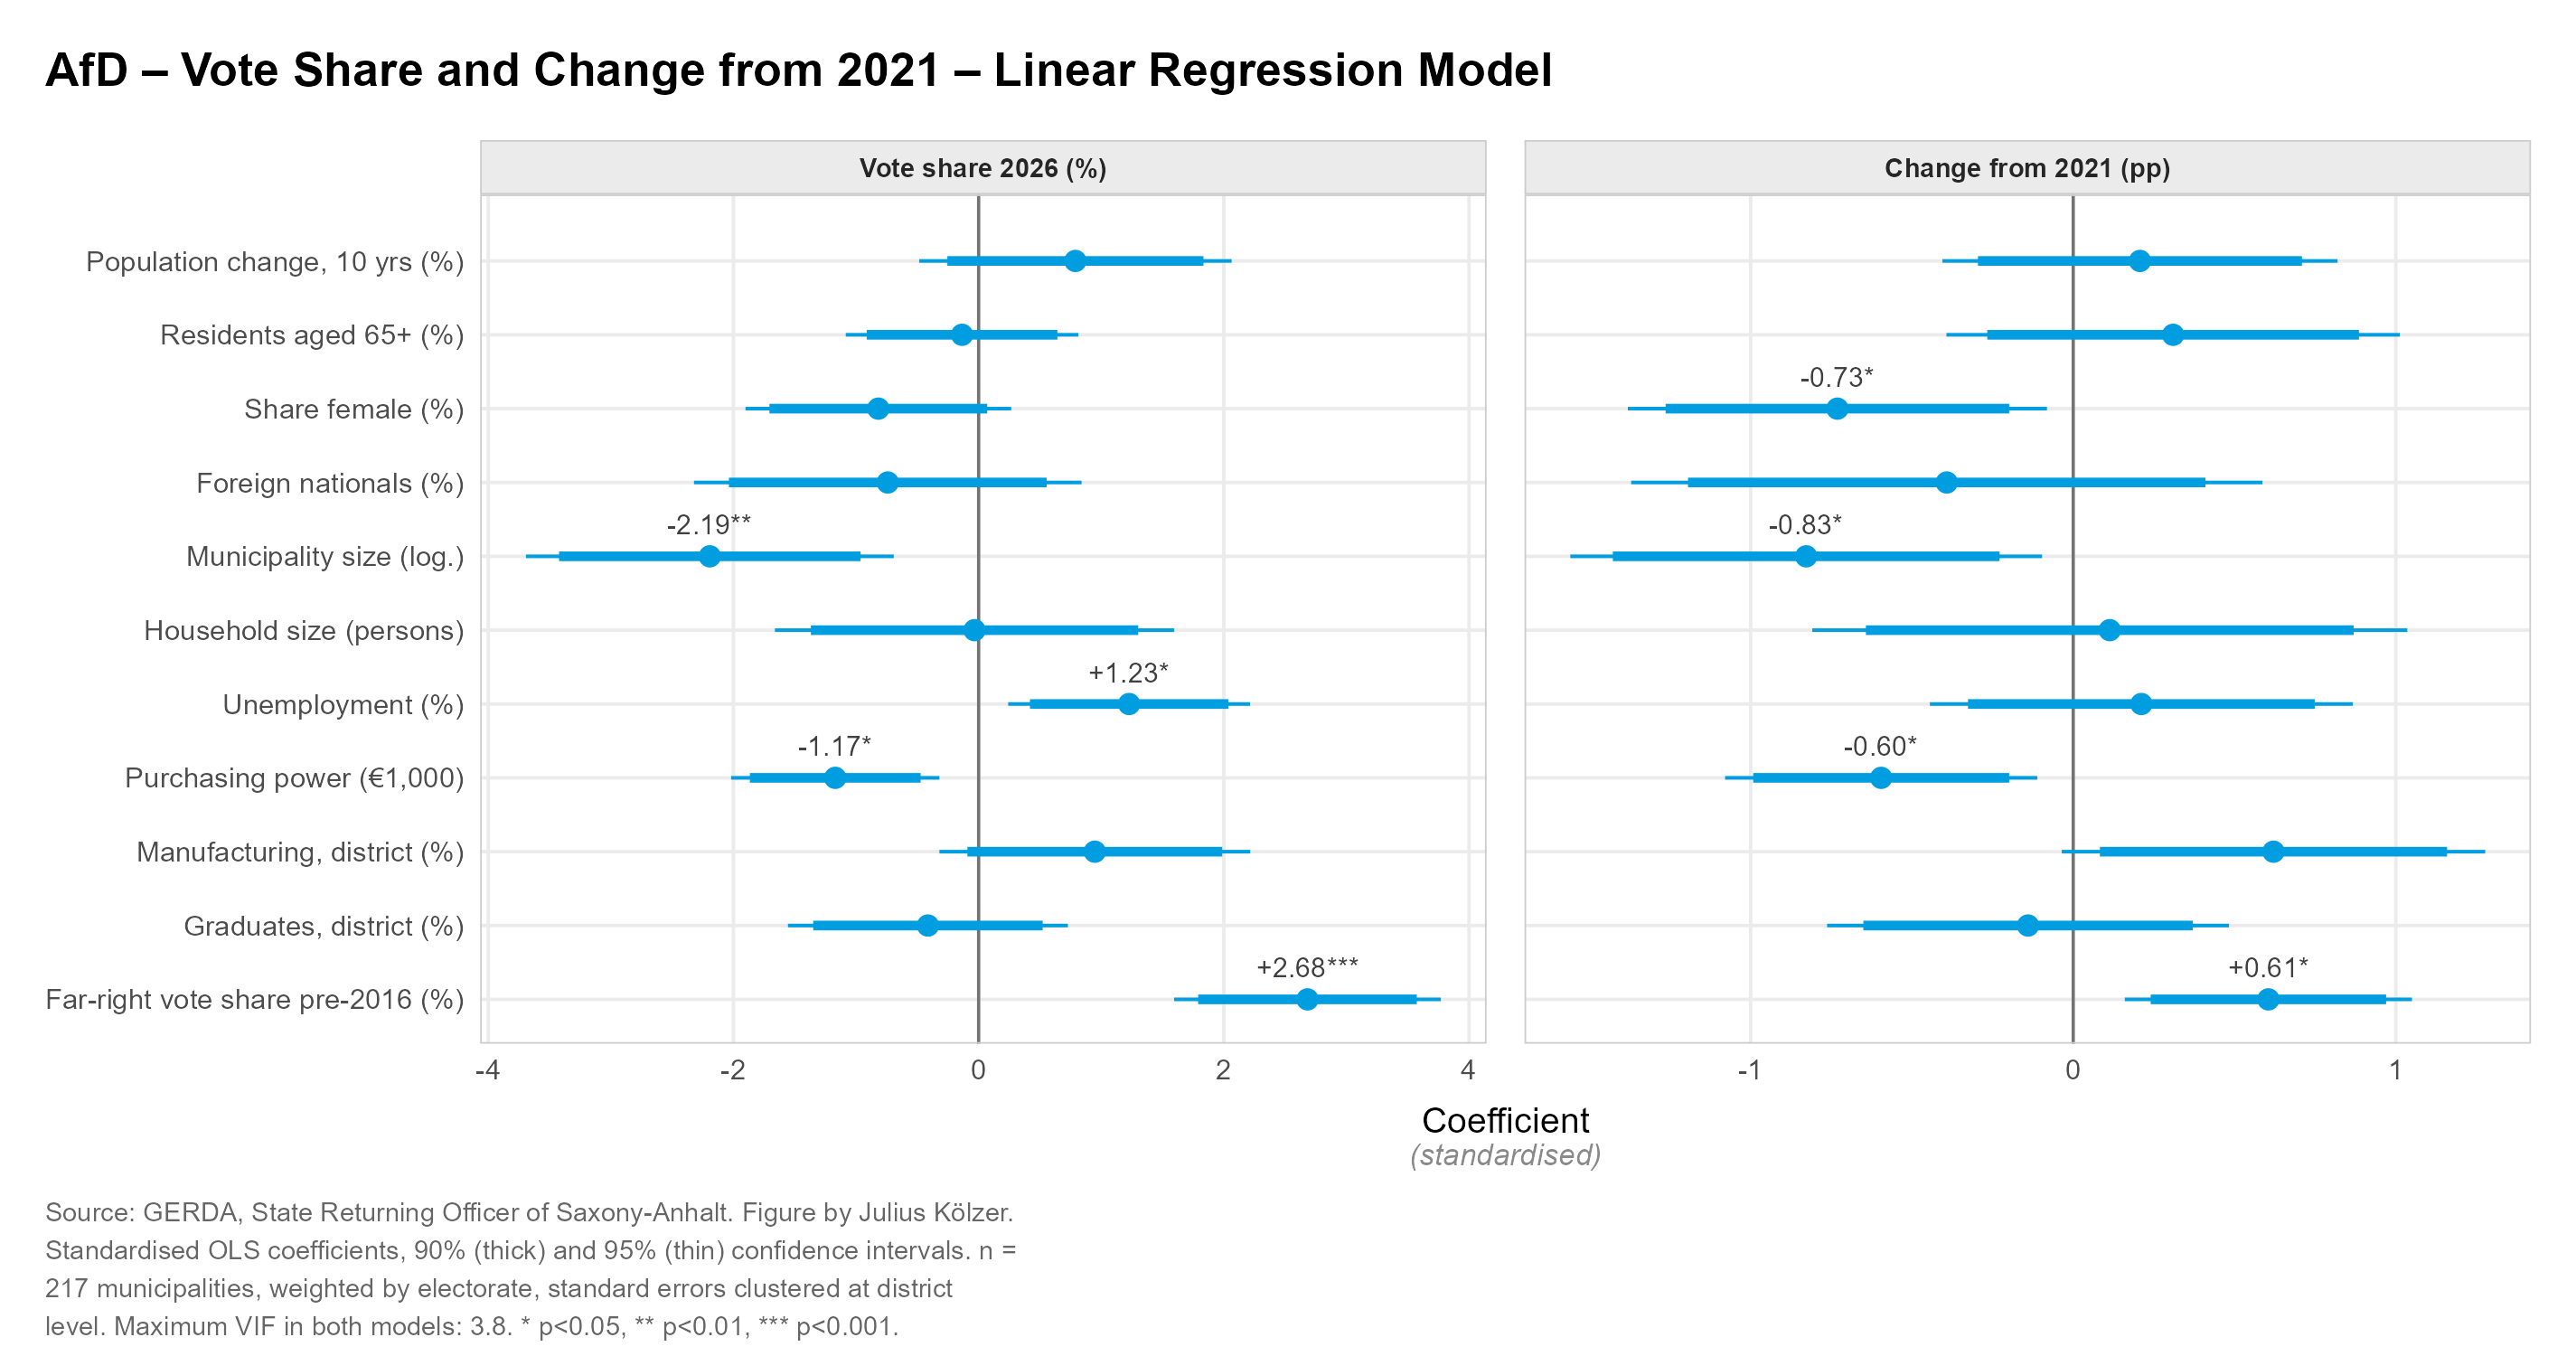
The full regression models for all parties are in the appendix.
CDU
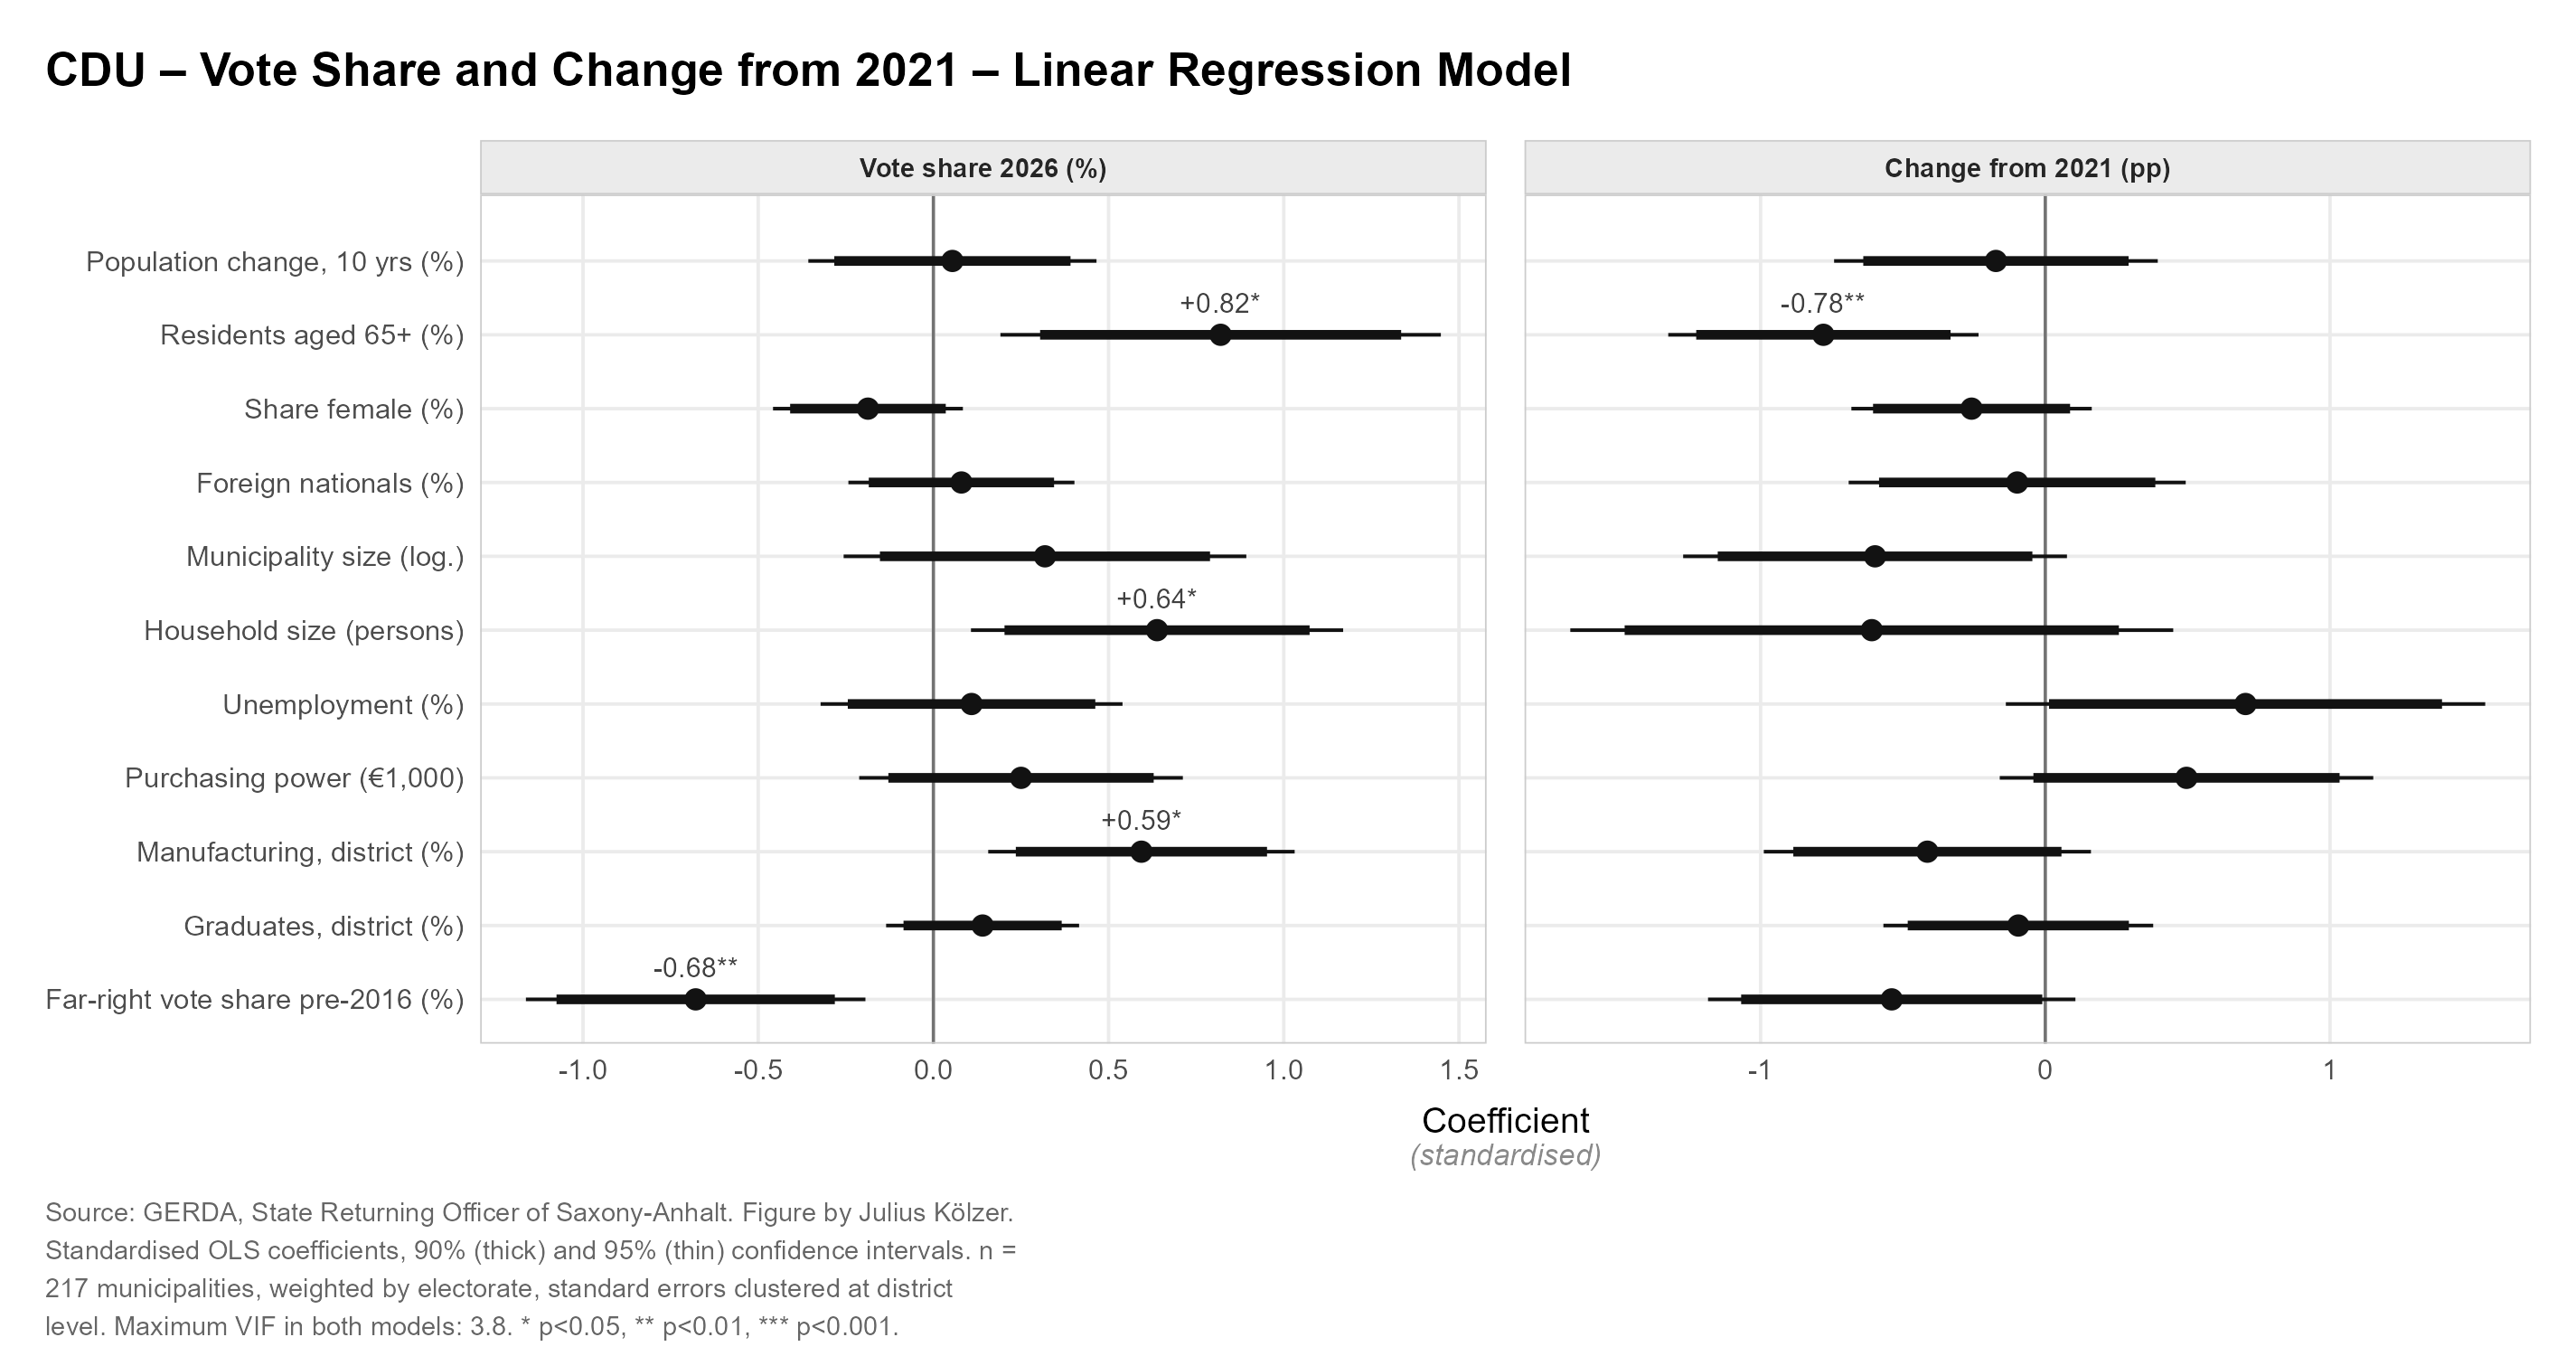
The model for the CDU’s 2026 vote share identifies several statistically significant associations. Support is higher in municipalities with larger shares of older residents, larger average household size, and a stronger concentration of manufacturing employment, although these correlations are comparatively weak. The model for electoral change since 2021 yields an even weaker structural pattern. The only statistically significant coefficient is for the share of residents aged 65 and over, indicating that CDU losses are smaller in municipalities with older populations. None of the remaining covariates is statistically distinguishable from zero.
SPD
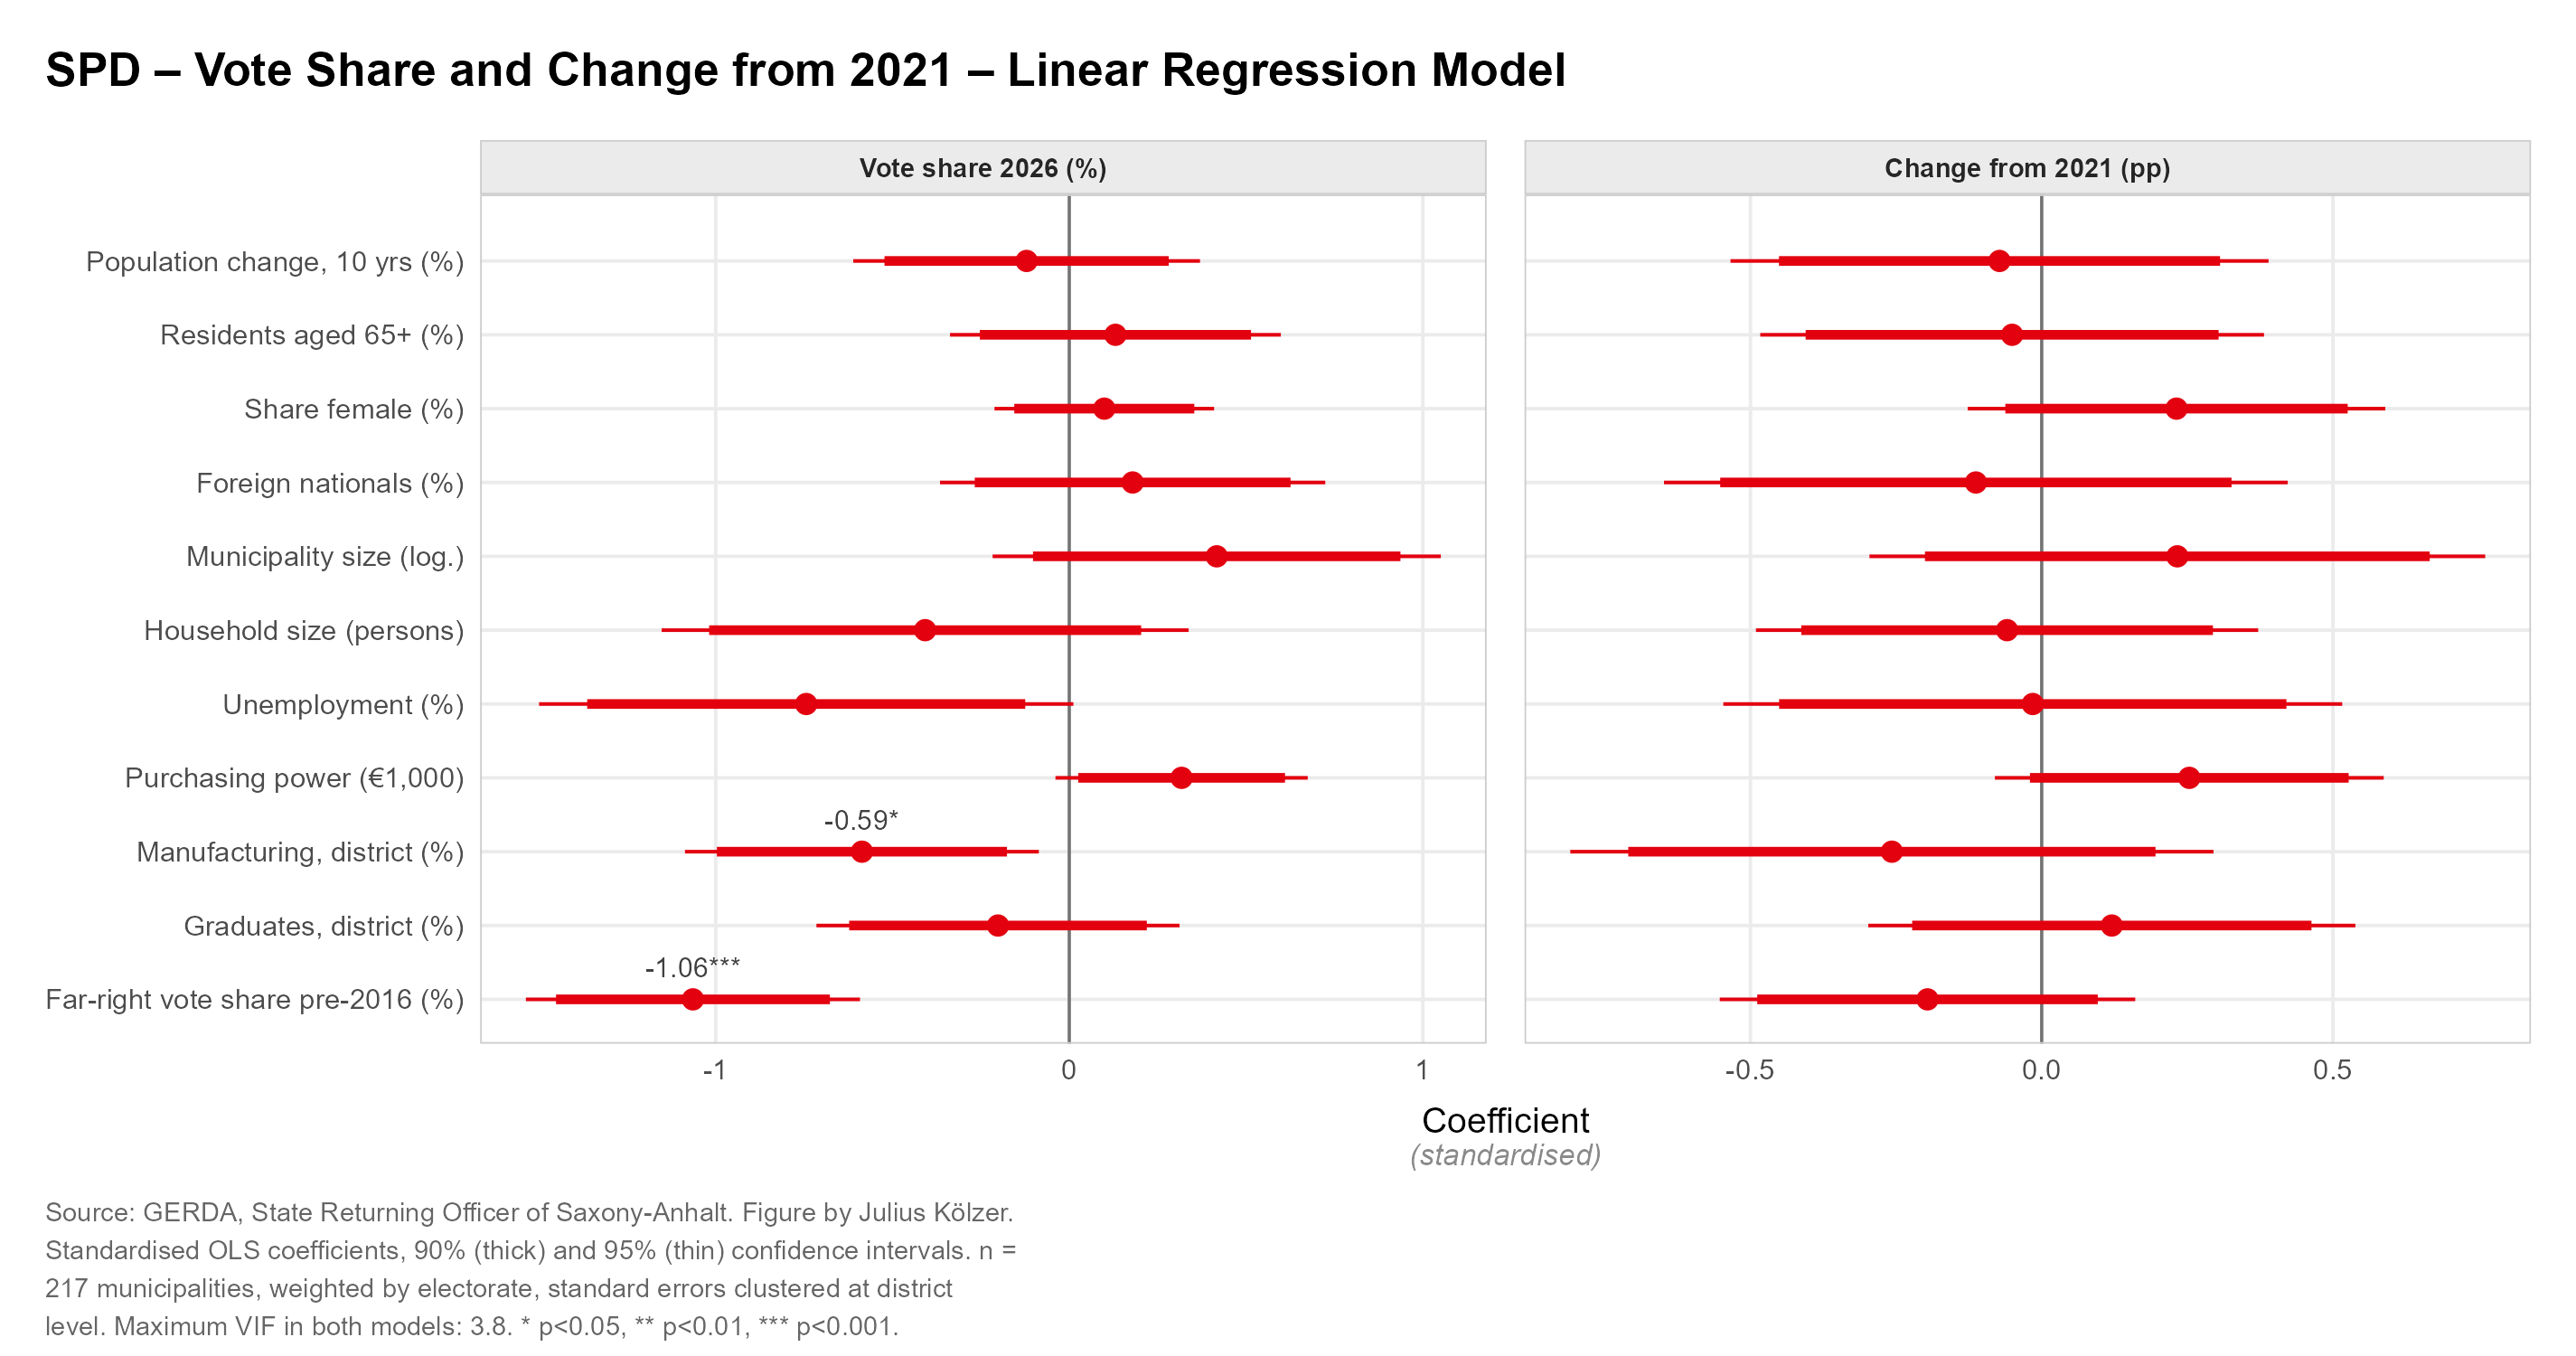
The model for the SPD’s 2026 vote share shows a comparatively clear pattern concentrated on a small number of covariates. First, SPD support is negatively associated with the local concentration of manufacturing employment: vote shares tend to be lower in more industrial municipalities. An even stronger negative association emerges with the earlier strength of far-right parties. Where the DVU, NPD, and Republikaner had achieved higher vote shares before 2016, the SPD performs markedly worse today. None of the remaining structural characteristics is statistically significant in the joint model. The model for electoral change since 2021 yields an even weaker pattern: none of the included covariates is statistically significant, consistent with the SPD maintaining comparatively stable vote shares across different types of municipalities.
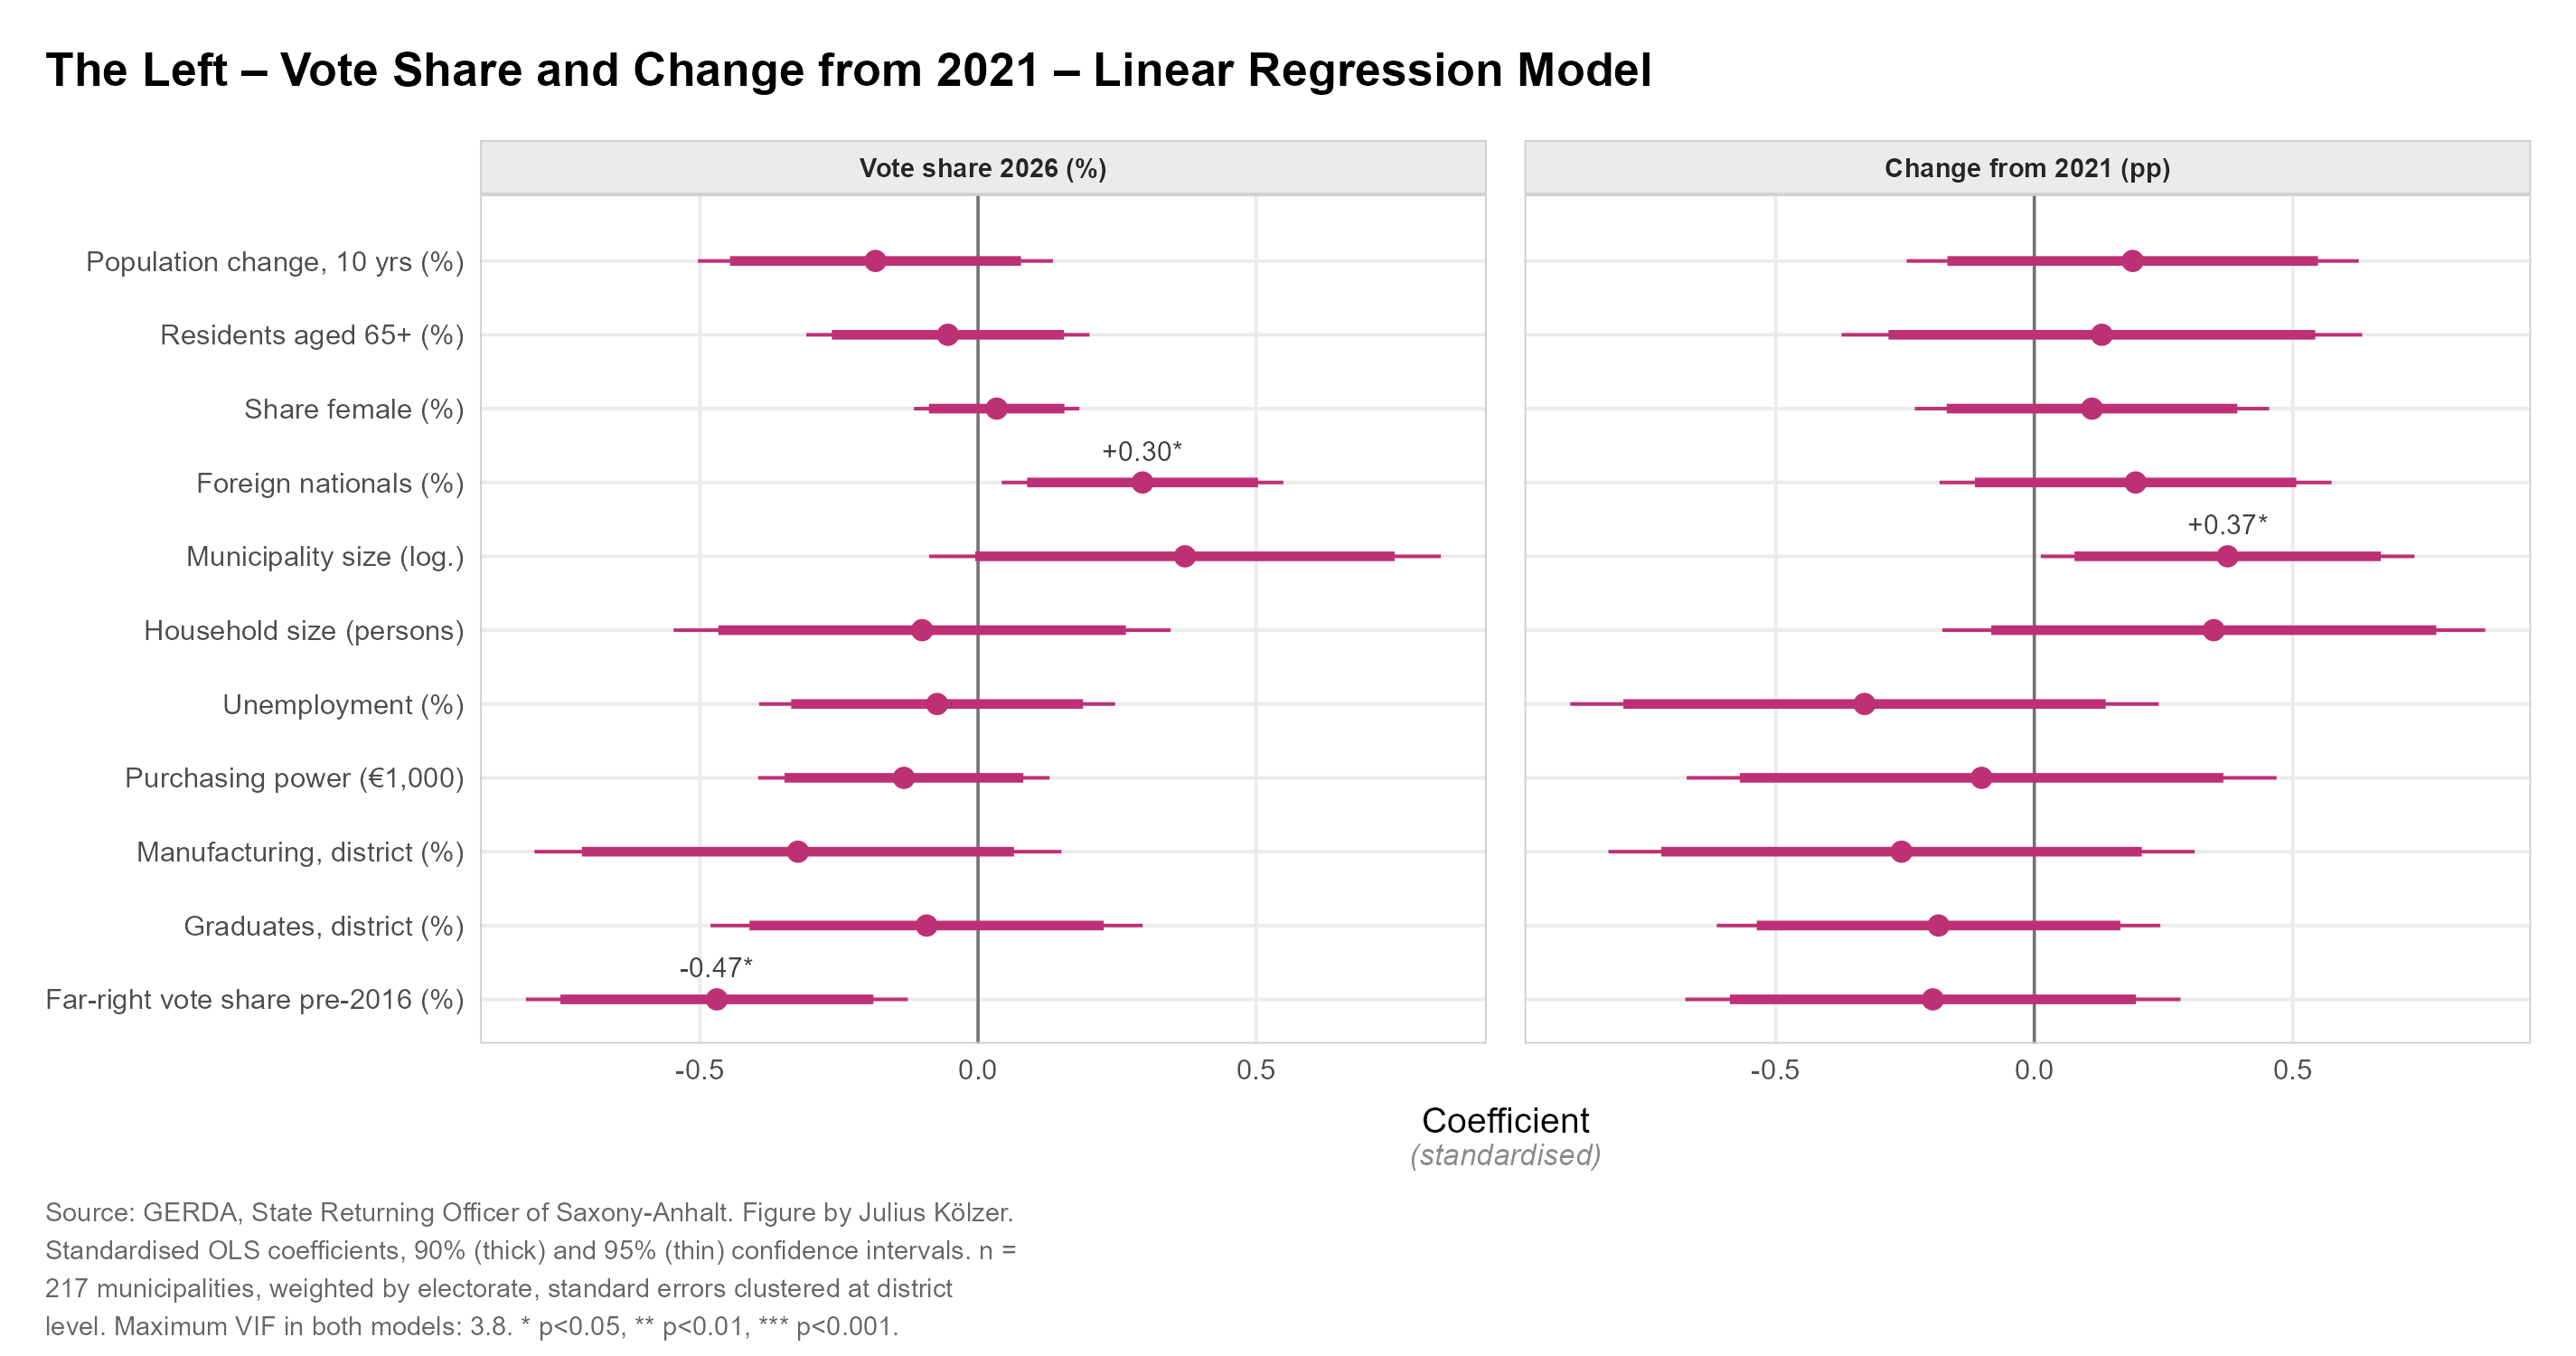
The Left
The model for The Left’s 2026 vote share yields a less clear-cut pattern overall, which may partly reflect the composition of its current electorate. The party remains anchored in parts of its older, more distinctly East German support base while increasingly performing better in larger and more urban municipalities. These different social and spatial components may partly offset one another in the multivariate model. Accordingly, only a small number of structural characteristics are statistically significant. The share of foreign nationals is positively associated with The Left’s vote share, whereas earlier support for far-right parties is negatively associated with its current performance. The model for electoral change since 2021 points most clearly to municipality size: losses are significantly smaller in larger municipalities, indicating that The Left has been better able to maintain its support in more urban areas.
Greens
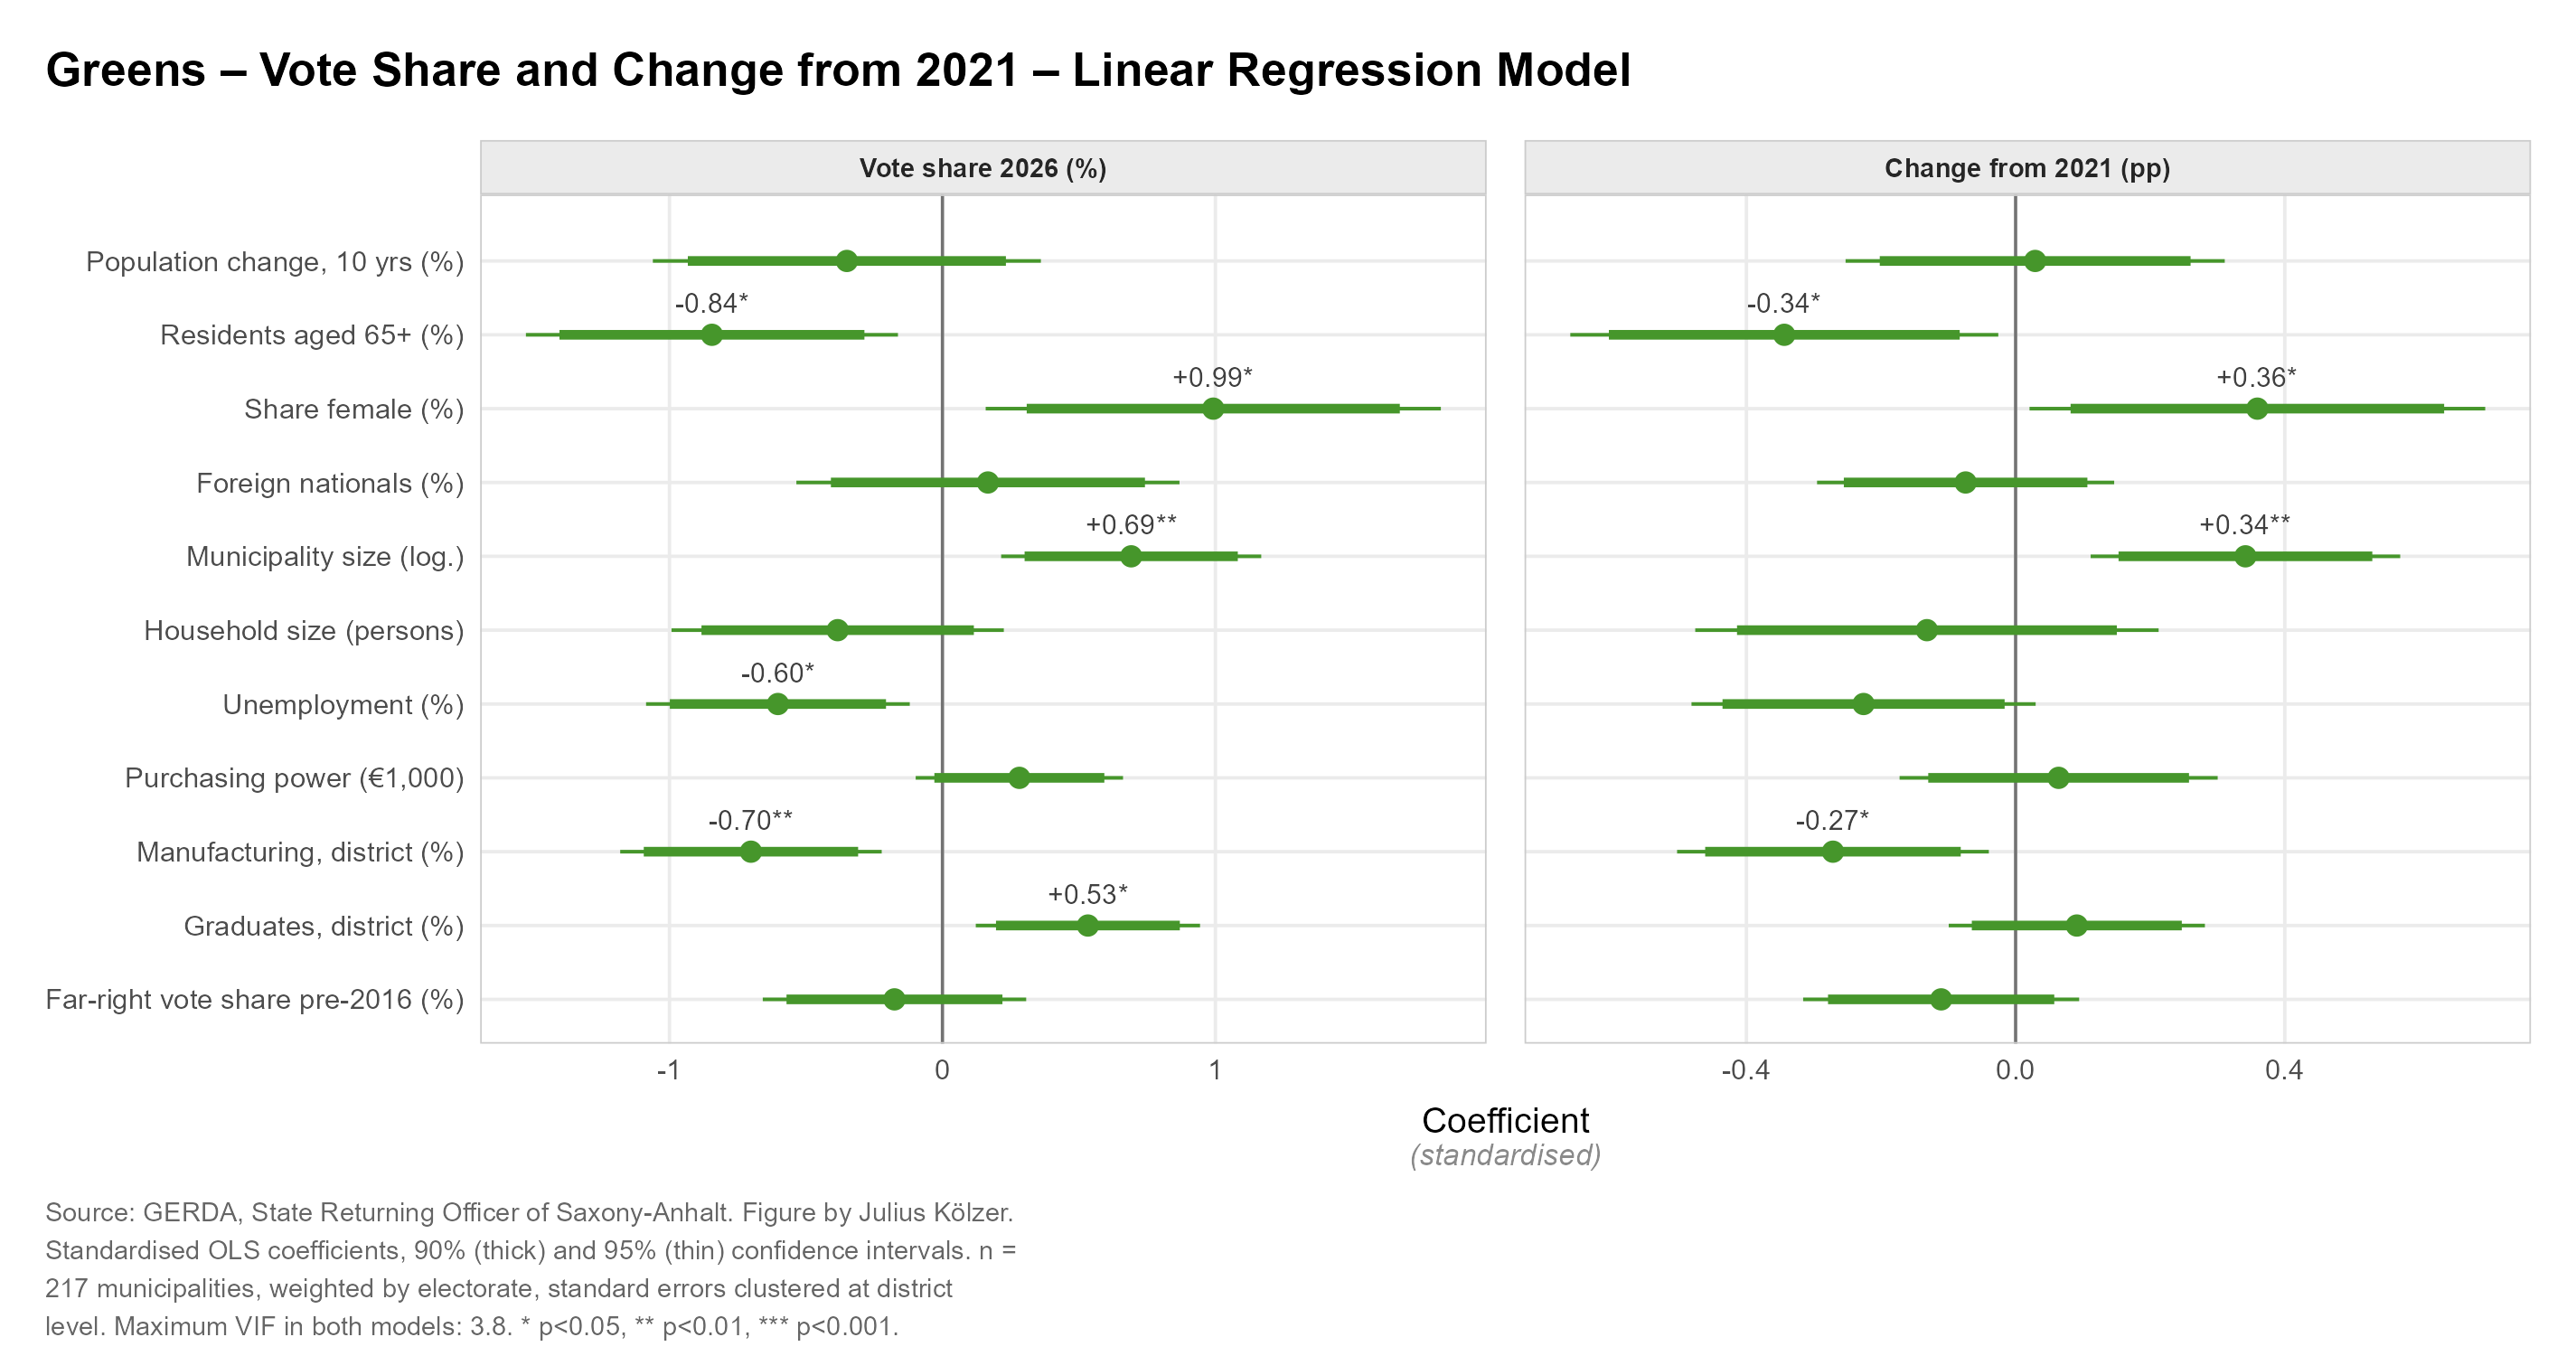
For the Greens, the structural correlates of the 2026 vote share are particularly pronounced. Support is significantly higher in larger municipalities and in municipalities with higher shares of women and university graduates. By contrast, vote shares are significantly lower where the share of residents aged 65 and over, unemployment, and the concentration of manufacturing employment are higher. The multivariate results therefore confirm the distinctly urban and socially differentiated profile of Green support identified above. Electoral change since 2021 follows a similar pattern: gains are significantly larger in larger municipalities and in places with higher shares of women and lower shares of older residents. A stronger concentration of manufacturing employment is also associated with smaller gains, while none of the remaining covariates shows a statistically significant association with electoral change.
BSW
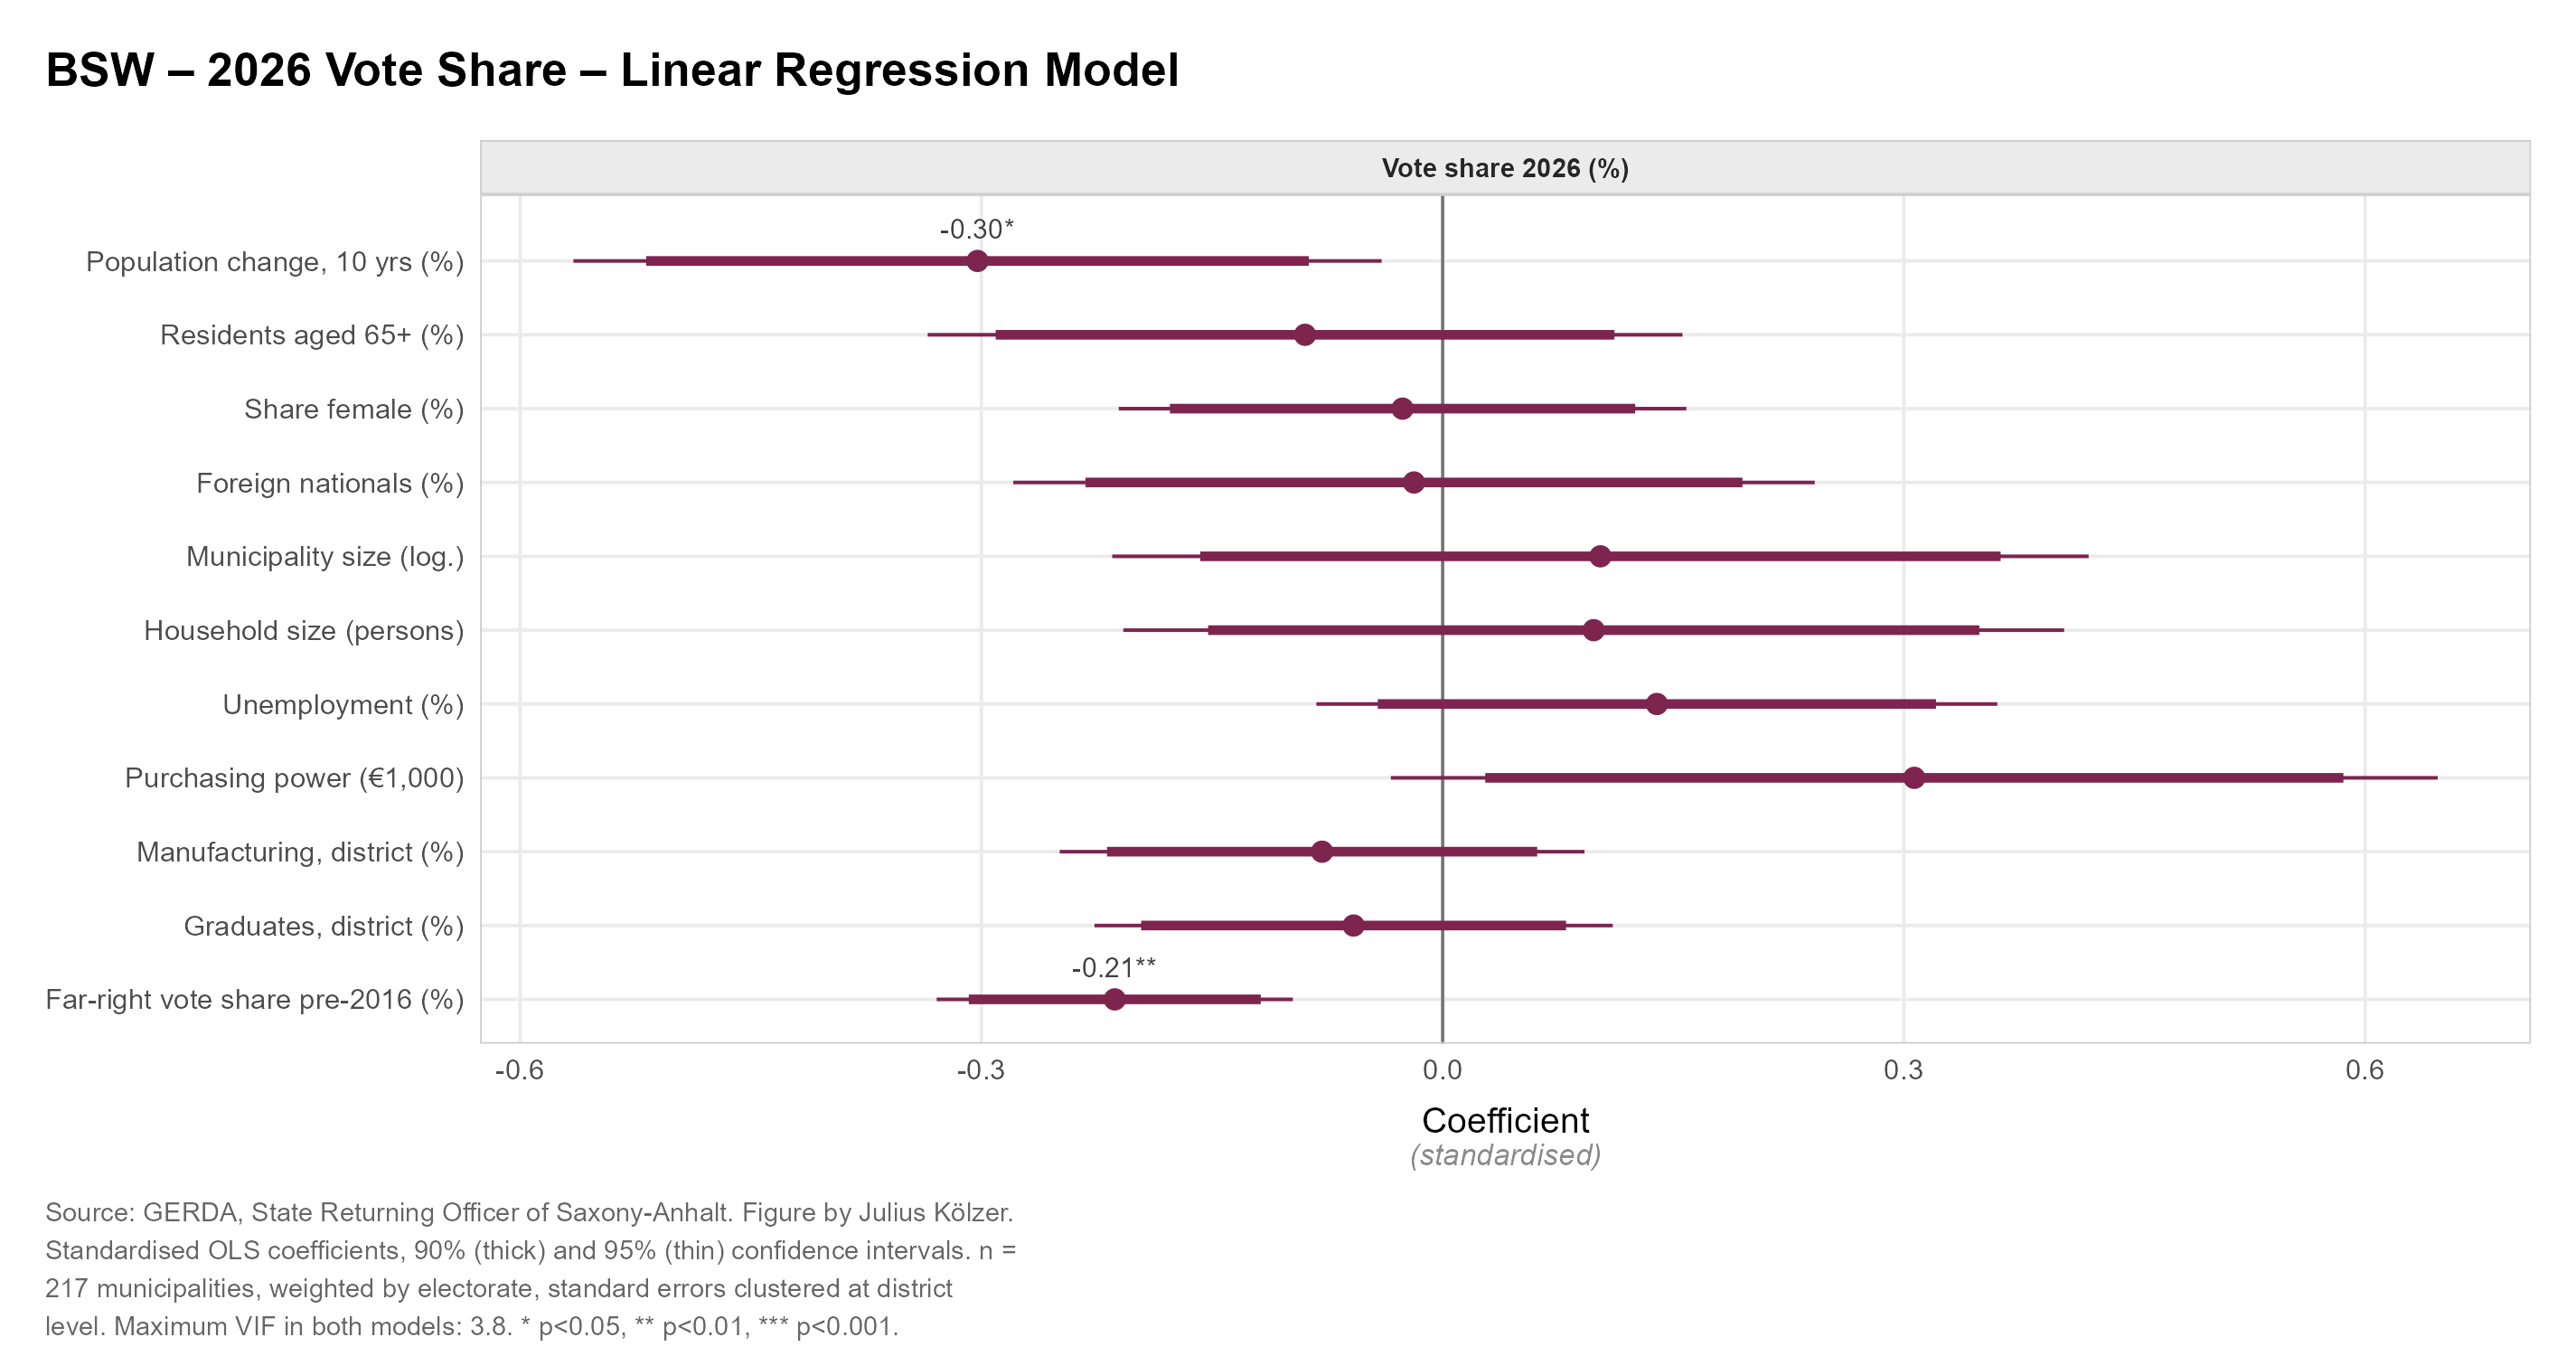
Finally, the regression model for the BSW reveals only a weak structural pattern. Since the party is contesting a Saxony-Anhalt state election for the first time, only its 2026 vote share can be modelled. Support is significantly higher in municipalities experiencing stronger population decline. At the same time, BSW vote shares are significantly lower where far-right parties had already been particularly strong before 2016. By contrast, municipality size, age structure, the shares of women and foreign nationals, unemployment, purchasing power, manufacturing employment, and the share of university graduates show no statistically significant associations. Overall, BSW support is therefore considerably less clearly structured by local characteristics than support for either the AfD or the Greens.
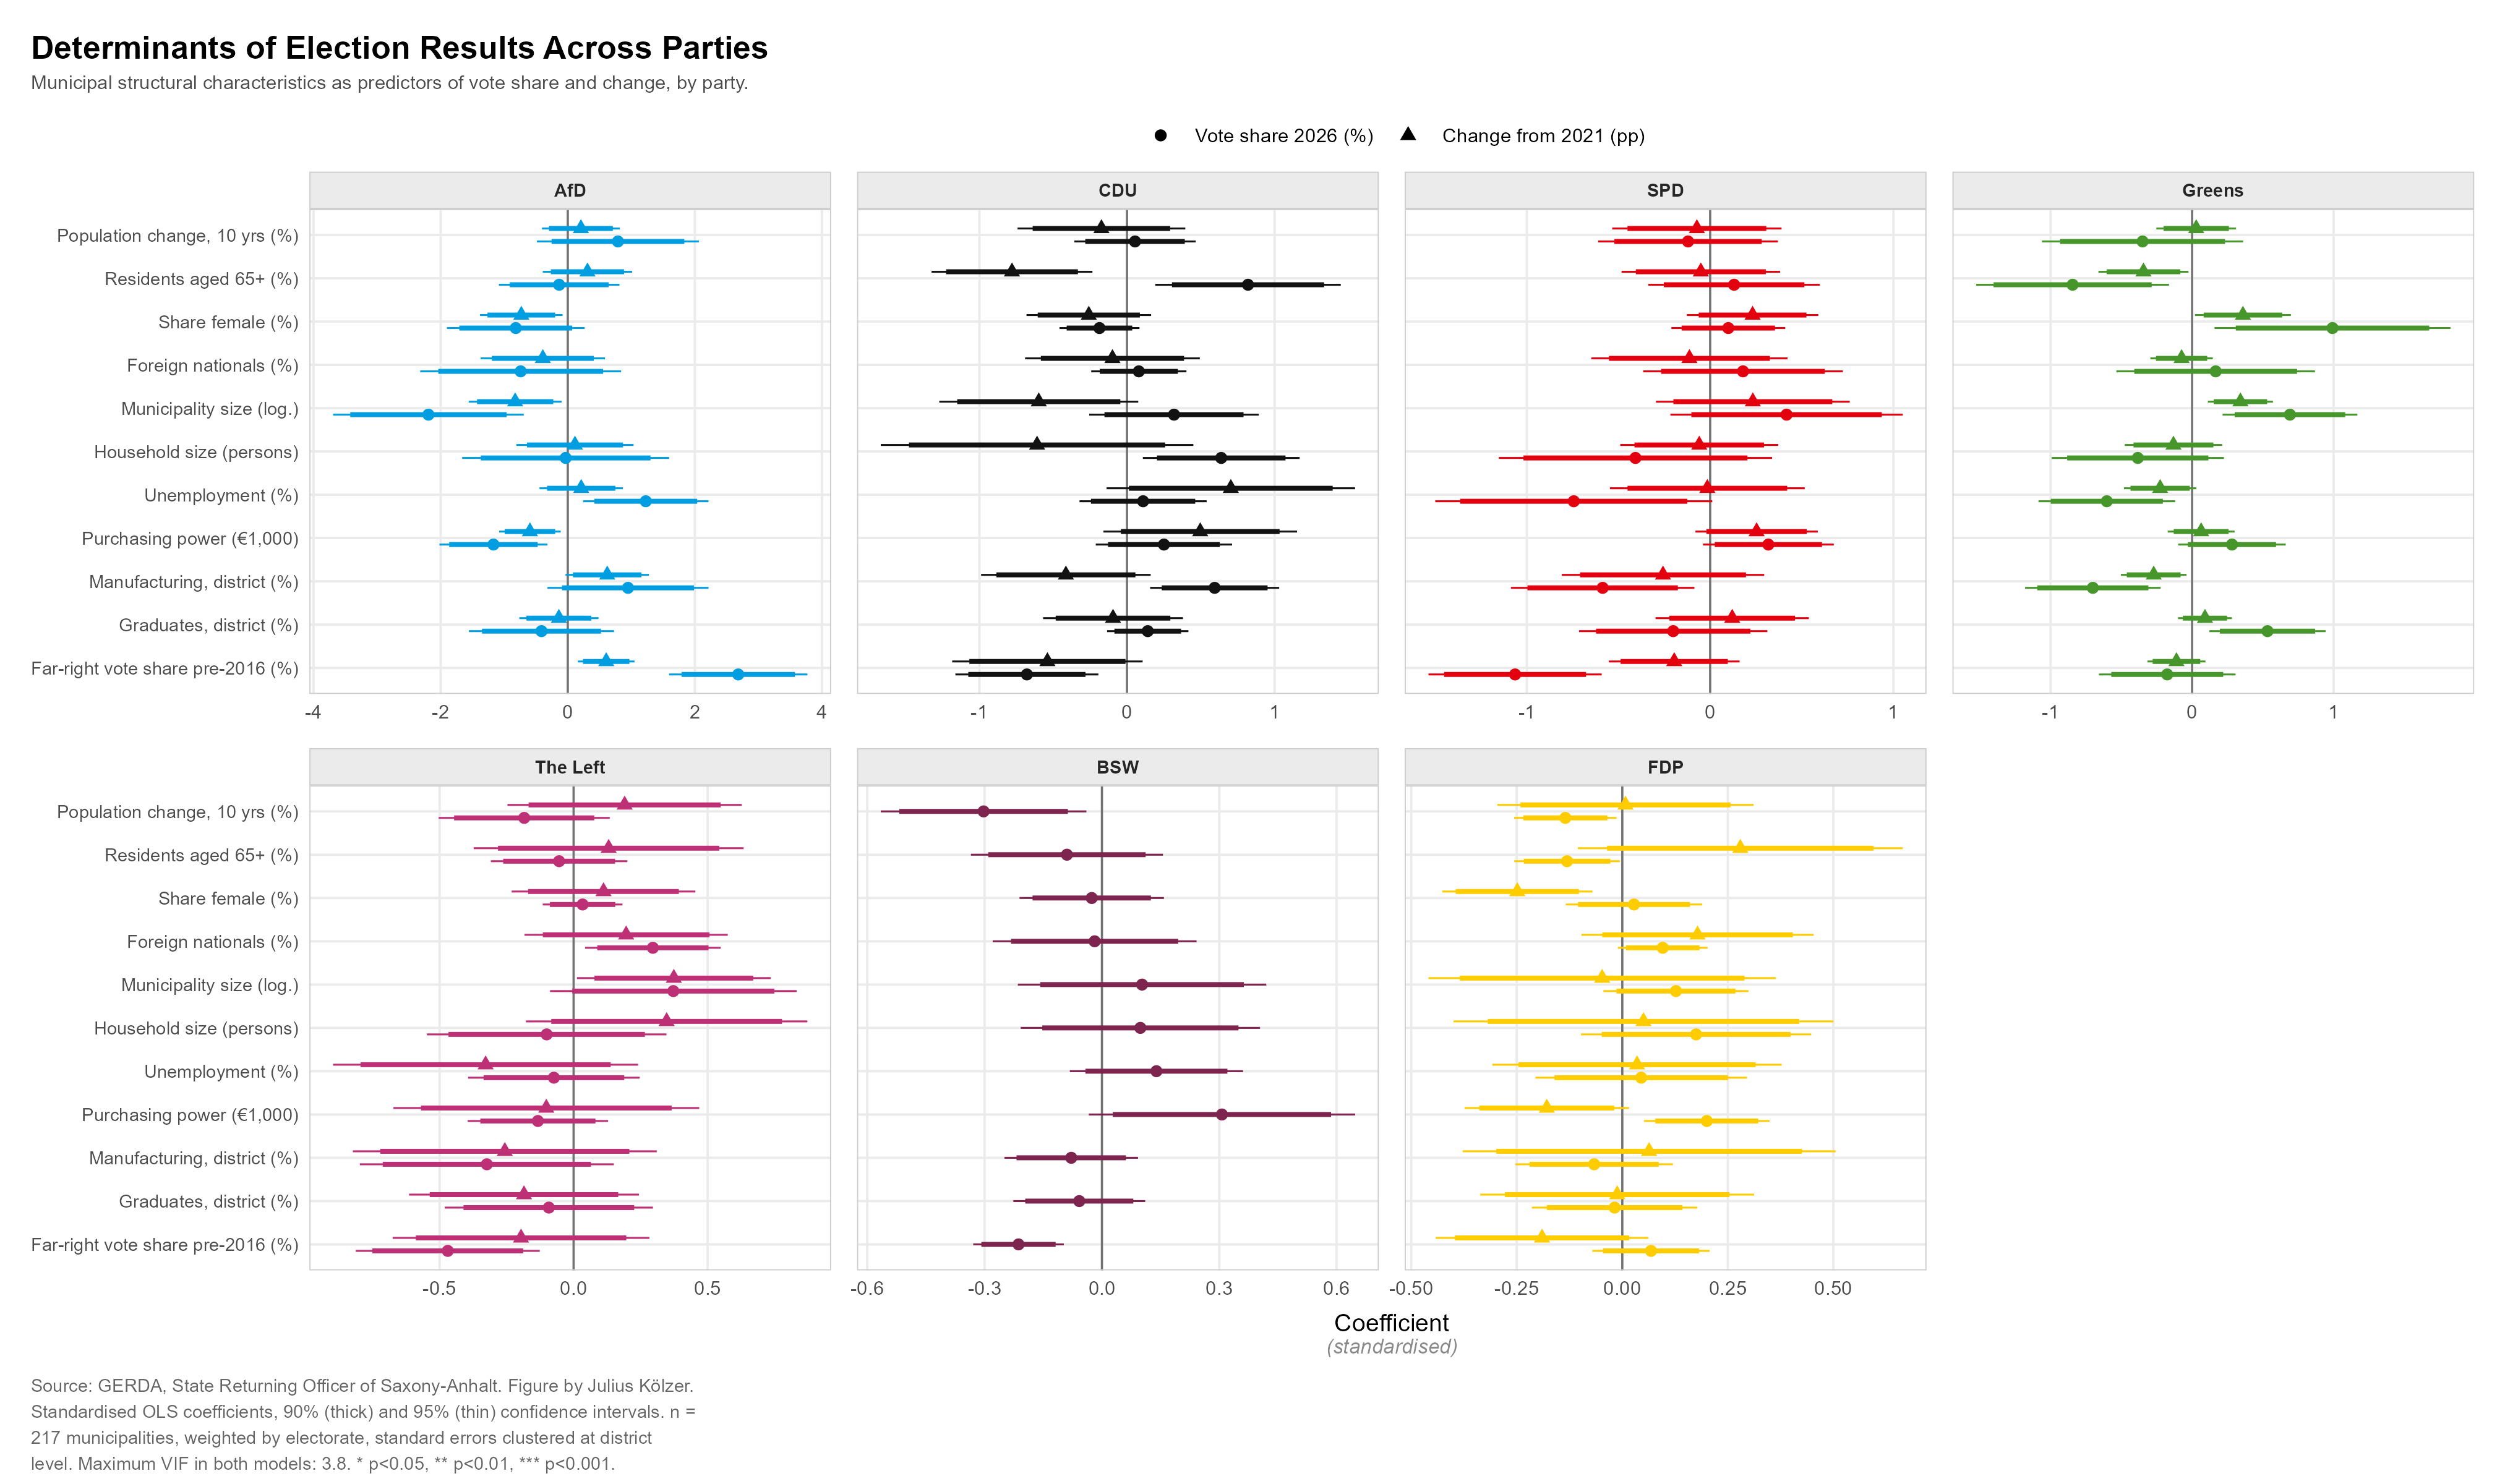
All Parties Compared
Show figure: all parties compared
Appendix: Regression Models
AfD
| Vote share 2026 (%) | Change from 2021 (pp) | |
|---|---|---|
| Population change, 10 yrs (%) | 0.79 (0.59) | 0.21 (0.28) |
| Residents aged 65+ (%) | -0.14 (0.44) | 0.31 (0.33) |
| Share female (%) | -0.82 (0.50) | -0.73* (0.30) |
| Foreign nationals (%) | -0.74 (0.73) | -0.39 (0.45) |
| Municipality size (log.) | -2.19** (0.69) | -0.83* (0.34) |
| Household size (persons) | -0.03 (0.75) | 0.11 (0.43) |
| Unemployment (%) | 1.23* (0.46) | 0.21 (0.30) |
| Purchasing power (€1,000) | -1.17* (0.39) | -0.60* (0.22) |
| Manufacturing, district (%) | 0.95 (0.59) | 0.62 (0.30) |
| Graduates, district (%) | -0.41 (0.53) | -0.14 (0.29) |
| Far-right vote share pre-2016 (%) | 2.68*** (0.50) | 0.61* (0.21) |
| N | 217 | 217 |
| R² | 0.87 | 0.82 |
CDU
| Vote share 2026 (%) | Change from 2021 (pp) | |
|---|---|---|
| Population change, 10 yrs (%) | 0.05 (0.19) | -0.17 (0.26) |
| Residents aged 65+ (%) | 0.82* (0.29) | -0.78** (0.25) |
| Share female (%) | -0.19 (0.13) | -0.26 (0.20) |
| Foreign nationals (%) | 0.08 (0.15) | -0.10 (0.27) |
| Municipality size (log.) | 0.32 (0.27) | -0.60 (0.31) |
| Household size (persons) | 0.64* (0.25) | -0.61 (0.49) |
| Unemployment (%) | 0.11 (0.20) | 0.70 (0.39) |
| Purchasing power (€1,000) | 0.25 (0.21) | 0.50 (0.30) |
| Manufacturing, district (%) | 0.59* (0.20) | -0.41 (0.27) |
| Graduates, district (%) | 0.14 (0.13) | -0.09 (0.22) |
| Far-right vote share pre-2016 (%) | -0.68** (0.22) | -0.54 (0.30) |
| N | 217 | 217 |
| R² | 0.62 | 0.43 |
SPD
| Vote share 2026 (%) | Change from 2021 (pp) | |
|---|---|---|
| Population change, 10 yrs (%) | -0.12 (0.23) | -0.07 (0.21) |
| Residents aged 65+ (%) | 0.13 (0.22) | -0.05 (0.20) |
| Share female (%) | 0.10 (0.14) | 0.23 (0.17) |
| Foreign nationals (%) | 0.18 (0.25) | -0.11 (0.25) |
| Municipality size (log.) | 0.42 (0.29) | 0.23 (0.24) |
| Household size (persons) | -0.41 (0.34) | -0.06 (0.20) |
| Unemployment (%) | -0.74 (0.35) | -0.02 (0.25) |
| Purchasing power (€1,000) | 0.32 (0.17) | 0.25 (0.15) |
| Manufacturing, district (%) | -0.59* (0.23) | -0.26 (0.26) |
| Graduates, district (%) | -0.20 (0.24) | 0.12 (0.19) |
| Far-right vote share pre-2016 (%) | -1.06*** (0.22) | -0.20 (0.17) |
| N | 217 | 217 |
| R² | 0.72 | 0.57 |
Greens
| Vote share 2026 (%) | Change from 2021 (pp) | |
|---|---|---|
| Population change, 10 yrs (%) | -0.35 (0.33) | 0.03 (0.13) |
| Residents aged 65+ (%) | -0.84* (0.32) | -0.34* (0.15) |
| Share female (%) | 0.99* (0.39) | 0.36* (0.16) |
| Foreign nationals (%) | 0.17 (0.32) | -0.07 (0.10) |
| Municipality size (log.) | 0.69** (0.22) | 0.34** (0.11) |
| Household size (persons) | -0.38 (0.28) | -0.13 (0.16) |
| Unemployment (%) | -0.60* (0.22) | -0.23 (0.12) |
| Purchasing power (€1,000) | 0.28 (0.18) | 0.06 (0.11) |
| Manufacturing, district (%) | -0.70** (0.22) | -0.27* (0.11) |
| Graduates, district (%) | 0.53* (0.19) | 0.09 (0.09) |
| Far-right vote share pre-2016 (%) | -0.18 (0.22) | -0.11 (0.09) |
| N | 217 | 217 |
| R² | 0.94 | 0.86 |
The Left
| Vote share 2026 (%) | Change from 2021 (pp) | |
|---|---|---|
| Population change, 10 yrs (%) | -0.18 (0.15) | 0.19 (0.20) |
| Residents aged 65+ (%) | -0.05 (0.12) | 0.13 (0.23) |
| Share female (%) | 0.03 (0.07) | 0.11 (0.16) |
| Foreign nationals (%) | 0.30* (0.12) | 0.20 (0.18) |
| Municipality size (log.) | 0.37 (0.21) | 0.37* (0.17) |
| Household size (persons) | -0.10 (0.21) | 0.35 (0.24) |
| Unemployment (%) | -0.07 (0.15) | -0.33 (0.26) |
| Purchasing power (€1,000) | -0.13 (0.12) | -0.10 (0.26) |
| Manufacturing, district (%) | -0.32 (0.22) | -0.26 (0.26) |
| Graduates, district (%) | -0.09 (0.18) | -0.19 (0.20) |
| Far-right vote share pre-2016 (%) | -0.47* (0.16) | -0.20 (0.22) |
| N | 217 | 217 |
| R² | 0.80 | 0.24 |
BSW
| Vote share 2026 (%) | |
|---|---|
| Population change, 10 yrs (%) | -0.30* (0.12) |
| Residents aged 65+ (%) | -0.09 (0.11) |
| Share female (%) | -0.03 (0.09) |
| Foreign nationals (%) | -0.02 (0.12) |
| Municipality size (log.) | 0.10 (0.15) |
| Household size (persons) | 0.10 (0.14) |
| Unemployment (%) | 0.14 (0.10) |
| Purchasing power (€1,000) | 0.31 (0.16) |
| Manufacturing, district (%) | -0.08 (0.08) |
| Graduates, district (%) | -0.06 (0.08) |
| Far-right vote share pre-2016 (%) | -0.21** (0.05) |
| N | 217 |
| R² | 0.16 |
FDP
| Vote share 2026 (%) | Change from 2021 (pp) | |
|---|---|---|
| Population change, 10 yrs (%) | -0.13* (0.06) | 0.01 (0.14) |
| Residents aged 65+ (%) | -0.13* (0.06) | 0.28 (0.18) |
| Share female (%) | 0.03 (0.07) | -0.25** (0.08) |
| Foreign nationals (%) | 0.10 (0.05) | 0.18 (0.13) |
| Municipality size (log.) | 0.13 (0.08) | -0.05 (0.19) |
| Household size (persons) | 0.17 (0.13) | 0.05 (0.21) |
| Unemployment (%) | 0.04 (0.12) | 0.03 (0.16) |
| Purchasing power (€1,000) | 0.20* (0.07) | -0.18 (0.09) |
| Manufacturing, district (%) | -0.07 (0.09) | 0.06 (0.20) |
| Graduates, district (%) | -0.02 (0.09) | -0.01 (0.15) |
| Far-right vote share pre-2016 (%) | 0.07 (0.06) | -0.19 (0.12) |
| N | 217 | 217 |
| R² | 0.23 | 0.21 |
OLS at municipality level, weighted by the number of eligible voters, standard errors clustered at district level (in parentheses). All covariates z-standardised; dependent variable in per cent (level) or percentage points (change). * p<0.05, ** p<0.01, *** p<0.001.
References
- Arzheimer, Kai / Berning, Carl C. (2019): How the Alternative for Germany (AfD) and their voters veered to the radical right, 2013–2017. Electoral Studies 60. Link
- Bayerlein, Michael / Kölzer, Julius / Metten, Anne (2026): Industrial Employment and Populism in Germany – Exploring the Effect of Actual and Looming Decline. Politische Vierteljahresschrift. doi:10.1007/s11615-025-00606-w
- Bergmann, Knut / Diermeier, Matthias / Niehues, Judith (2017): Die AfD: Eine Partei der sich ausgeliefert fühlenden Durchschnittsverdiener? Zeitschrift für Parlamentsfragen 48(1), 57–75.
- Cantoni, Davide / Hagemeister, Felix / Westcott, Mark (2019): Persistence and Activation of Right-Wing Political Ideology. Working Paper, Ludwig-Maximilians-Universität München.
- Deppisch, Larissa / Klärner, Andreas (2025): Discontent in ‘left-behind places’? How perception of space and local political climate matter for the success of right-wing populism in rural areas of Germany. Regional Studies. doi:10.1080/00343404.2025.2587811
- Deppisch, Larissa / Osigus, Torsten / Klärner, Andreas (2019): Ist die AfD in ländlichen Räumen besonders erfolgreich? In: Wissen schafft Demokratie 5. Jena: Institut für Demokratie und Zivilgesellschaft.
- Dijkstra, Lewis / Poelman, Hugo / Rodríguez-Pose, Andrés (2020): The geography of EU discontent. Regional Studies 54(6), 737–753. doi:10.1080/00343404.2019.1654603
- DIW Berlin (2026): Sachsen-Anhalt zeigt das AfD-Paradox. Strukturschwache AfD-Hochburgen würden unter ihrer Politik am stärksten leiden. DIW aktuell, Berlin.
- Förtner, Maximilian / Belina, Bernd / Naumann, Matthias (2021): The revenge of the village? The geography of right-wing populist electoral success, anti-politics, and austerity in Germany. Environment and Planning C: Politics and Space 39(3). doi:10.1177/2399654420951803
- Franz, Christian / Fratzscher, Marcel / Kritikos, Alexander S. (2018): German Right-Wing Party AfD Finds More Support in Rural Areas with Aging Populations. DIW Weekly Report 8(7/8), 69–79.
- Goerres, Achim / Spies, Dennis C. / Kumlin, Staffan (2018): The Electoral Supporter Base of the Alternative for Germany. Swiss Political Science Review 24(3), 246–269. doi:10.1111/spsr.12306
- Greve, Maria / Fritsch, Michael / Wyrwich, Michael (2023): Long-term decline of regions and the rise of populism: The case of Germany. Journal of Regional Science 63(2). doi:10.1111/jors.12627
- Haffert, Lukas (2022): Stadt, Land, Frust. Eine politische Vermessung. München: C.H. Beck.
- Haffert, Lukas / Mitteregger, Reto (2023): Cohorts and neighbors: Urban-rural conflict along the age gradient. Electoral Studies 86. Link
- Hansen, Michael A. / Olsen, Jonathan (2019): Flesh of the Same Flesh: A Study of Voters for the Alternative for Germany (AfD) in the 2017 Federal Election. German Politics 28(1), 1–19. doi:10.1080/09644008.2018.1509312
- Heckmann, Leon / Wurthmann, L. Constantin / Wagner, Sarah (2025): Who’s afraid of Sahra? Understanding the shift in votes towards Germany’s Bündnis Sahra Wagenknecht. Research & Politics. doi:10.1177/20531680241311504
- Heinze, Anna-Sophie / Kailitz, Steffen / Pickel, Gert / Weisskircher, Manès (2026): The AfD and its Electoral Persistence in Eastern Germany. Causes, Issues, and Implications. German Politics. doi:10.1080/09644008.2026.2689631
- Höhne, Benjamin / Kölzer, Julius / Träger, Hendrik (2025): Geography of Shrinkage: Local Population Decline and Electoral Support for the Anti-establishment Parties AfD and BSW in East German State Elections. German Politics. doi:10.1080/09644008.2025.2489409
- Holtmann, Everhard / Jaeck, Tobias / Völkl, Kerstin (2014): Sachsen-Anhalt-Monitor 2014. Festigung der Demokratie. Magdeburg: Landeszentrale für politische Bildung Sachsen-Anhalt.
- Immerzeel, Tim / Pickup, Mark (2015): Populist Radical Right Parties Mobilizing ‘the People’? The Role of Populist Radical Right Success in Voter Turnout. Electoral Studies 40. doi:10.1016/j.electstud.2015.10.007
- King, Gary (1997): A Solution to the Ecological Inference Problem. Reconstructing Individual Behavior from Aggregate Data. Princeton: Princeton University Press.
- Kölzer, Julius / Debus, Marc / Stecker, Christian (2025): Alte Wurzeln, neue Wurzeln? Zum Einfluss früherer rechtsradikaler Unterstützung auf den AfD-Wahlerfolg bei der Europawahl 2024. Politische Vierteljahresschrift 66(4), 847–865.
- Kröhnert, Steffen / Vollmer, Sebastian (2012): Gender-Specific Migration from Eastern to Western Germany: Where Have All the Young Women Gone? International Migration 50(5), 95–112. doi:10.1111/j.1468-2435.2012.00750.x
- Leibert, Tim (2016): She leaves, he stays? Sex-selective migration in rural East Germany. Journal of Rural Studies 43. Link
- Lengfeld, Holger (2017): Die „Alternative für Deutschland“: eine Partei für Modernisierungsverlierer? Kölner Zeitschrift für Soziologie und Sozialpsychologie 69(2), 209–232. doi:10.1007/s11577-017-0446-1
- Lux, Thomas (2018): Die AfD und die unteren Statuslagen. Eine Forschungsnotiz zu Holger Lengfelds Studie. Kölner Zeitschrift für Soziologie und Sozialpsychologie 70(2), 255–273. doi:10.1007/s11577-018-0521-2
- Mau, Steffen (2019): Lütten Klein. Leben in der ostdeutschen Transformationsgesellschaft. Berlin: Suhrkamp.
- Mau, Steffen (2024): Ungleich vereint. Warum der Osten anders bleibt. Berlin: Suhrkamp.
- Mau, Steffen / Lux, Thomas / Westheuser, Linus (2023): Triggerpunkte. Konsens und Konflikt in der Gegenwartsgesellschaft. Berlin: Suhrkamp.
- Pesthy, Maria / Mader, Matthias / Schoen, Harald (2021): Why Is the AfD so Successful in Eastern Germany? An Analysis of the Ideational Foundations of the AfD Vote in the 2017 Federal Election. Politische Vierteljahresschrift 62(1), 69–91. doi:10.1007/s11615-020-00285-9
- Rippl, Susanne / Seipel, Christian (2018): Modernisierungsverlierer, Cultural Backlash, Postdemokratie. Was erklärt rechtspopulistische Orientierungen? Kölner Zeitschrift für Soziologie und Sozialpsychologie 70(2), 237–254. doi:10.1007/s11577-018-0522-1
- Robinson, William S. (1950): Ecological Correlations and the Behavior of Individuals. American Sociological Review 15(3), 351–357.
- Rodríguez-Pose, Andrés (2018): The revenge of the places that don’t matter (and what to do about it). Cambridge Journal of Regions, Economy and Society 11(1), 189–209. doi:10.1093/cjres/rsx024
- Schäfer, Armin (2024): Steigert die AfD die Wahlbeteiligung? Die Nichtwähler:innen bei der Bundestagswahl 2021. In: Wahlen und Wähler. Wiesbaden: Springer VS. doi:10.1007/978-3-658-42694-1_4
- Schulte-Cloos, Julia (2022): Political potentials, deep-seated nativism and the success of the German AfD. Frontiers in Political Science 3, 698085.
- Schulte-Cloos, Julia / Leininger, Arndt (2022): Electoral participation, political disaffection, and the rise of the populist radical right. Party Politics 28(3), 431–443.
- Schütze, Stephan (2023): Left Behind Together and Voting for Populism: Regional Out-Migration, Civic Engagement and the Electoral Success of Populist Radical Right Parties. Social Sciences 12(8), 426. doi:10.3390/socsci12080426
- Thomeczek, Jan Philipp (2025): The Voting Potential of Bündnis Sahra Wagenknecht. Political Studies Review. doi:10.1177/14789299241264975
- Vehrkamp, Robert / Wegschaider, Klaudia (2017): Populäre Wahlen. Mobilisierung und Gegenmobilisierung der sozialen Milieus bei der Bundestagswahl 2017. Gütersloh: Bertelsmann Stiftung.
- Weisskircher, Manès (2020): The Strength of Far-Right AfD in Eastern Germany: The East-West Divide and the Multiple Causes behind ‘Populism’. The Political Quarterly 91(3). doi:10.1111/1467-923X.12859